
Natural gas has been in a period of consolidation for the last two months. However, it appears we may be getting ready for a breakout based on the recent price action, bullish COT data, seasonality and positive divergences that are currently taking place in the nat gas market.
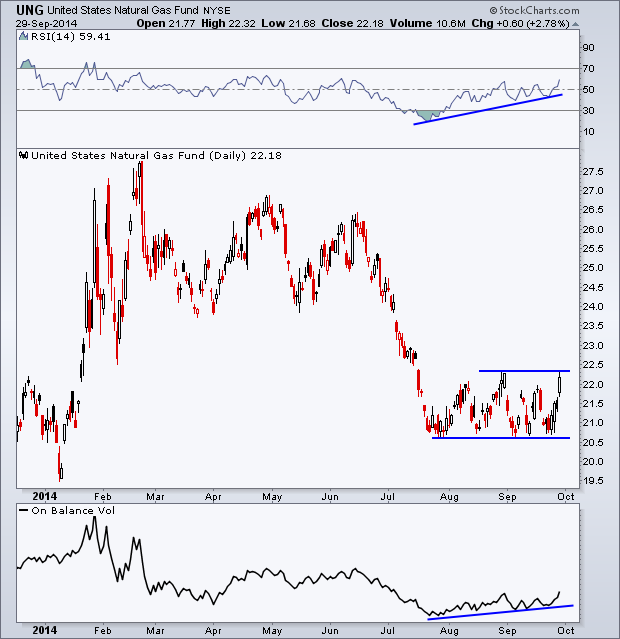
Below is a chart of the United States Natural Gas Fund ($UNG) going back the last nearly ten months. After the 22% drop from the last high made in June, price has been trading in a fairly tight range. This type of consolidation can produce some large moves as if it were a coil that was being pushed together. While this consolidation has been taking place, the Relative Strength Index has been putting in a series of higher lows. This bullish divergence has also led to the RSI making a higher high after Monday’s close.
In the bottom panel of the chart we have the On Balance Volume Indicator which simply adds the volume on positive days and subtracts the amount of shares traded on negative days. This tool can help us see if there is a bias towards buying or selling. Since the indicator has been rising its July low, we know that more shares have been traded when $UNG has been advancing compared to when it has been falling – a positive sign for nat gas bulls.
We’ll see if these bullish indicators of momentum and volume lead to price breaking above its August high.
Commitment of Traders
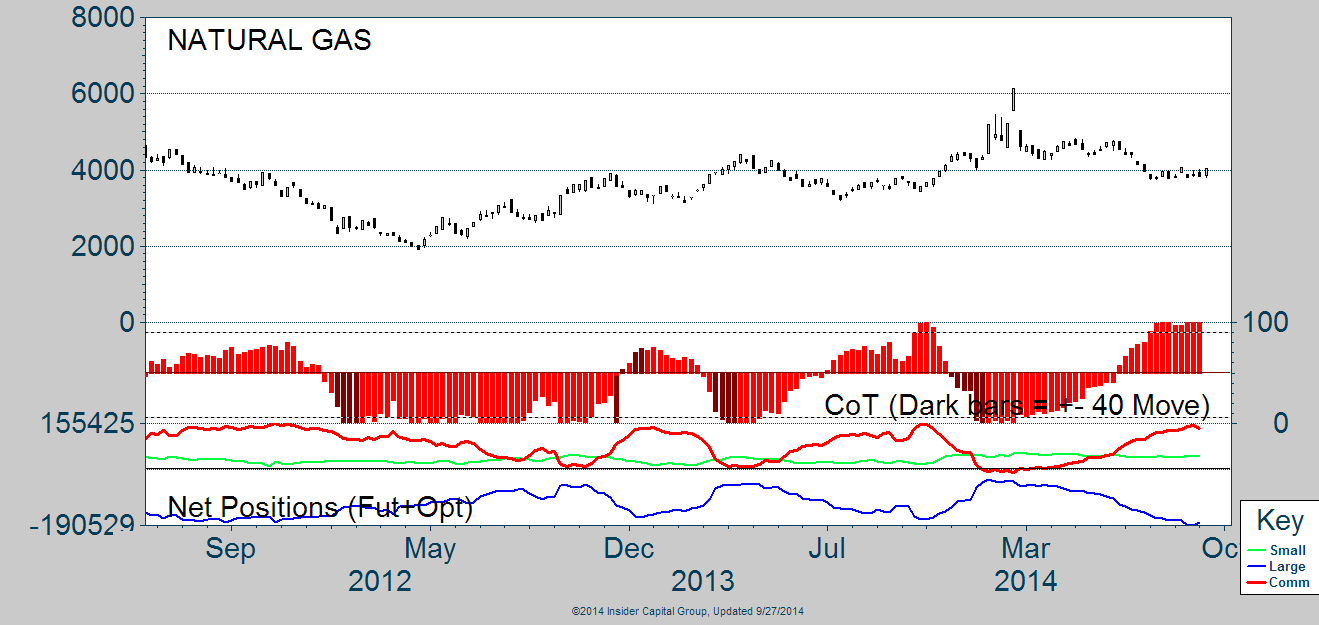
The next chart I want to show is of the Commitment of Traders (COT) data for Natural Gas. The red line in the bottom panel of the chart shows the Commercial Traders, which are often company’s that deal with natural gas within their own business, so they are often considered the ‘smart money’ within a market. After going net-short the commodity earlier this year right before price peaked, the Commercial Traders have been slowing building back their net-position towards a historically high level. Even during this period of consolidation, the ‘smart money’ appears to have been picking up contracts in Natural Gas.
Seasonality
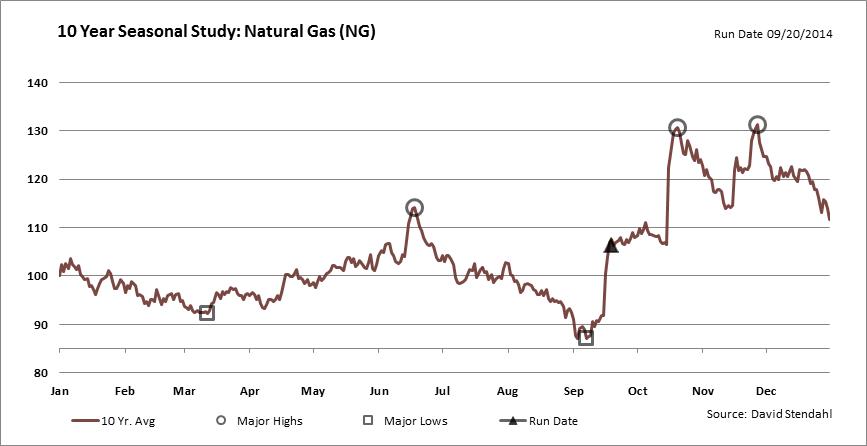
This final chart comes from Signal Financial Group and shows the 10-year seasonal trend for Natural Gas. Interestingly enough, the 5-, 10-, 15-, and 20-year seasonal trends all mirror one another, which in my opinion helps re-enforce the significance of this seasonal pattern. Like we have seen somewhat this year, price has put in a low in early September while showing slight strength during the last month. What catches my attention with this seasonal study is the large move towards the end of October that crates the historical first point of a double top before price has weakened into year-end and the first few months of the following year.
So it appears we have price getting ready to breakout of its two month consolidation. While at the same time momentum and volume are creating bullish divergences and the ‘smart money’ has been increasing their net-long position in Natural Gas based on COT data.
(At the time of this writing my firm holds shares of UNG in certain client accounts and may sell those holdings at any time. However, this is not a recommendation to buy or sell UNG, other natural gas-related or any investment vehicle.)
Disclaimer: Do not construe anything written in this post or this blog in its entirety as a recommendation, research, or an offer to buy or sell any securities. Everything in this post is meant for educational and entertainment purposes only. I or my affiliates may hold positions in securities mentioned in the blog. Please see my Disclosure page for full disclaimer. Connect with Andrew on Google+, Twitter, and StockTwits.
Copyright © Andrew Thrasher