by Eddy Elfenbein, Crossing Wall Street
I had a little extra time this morning, so I’d thought I’d do a quick post which explains the entire stock market for you.
Before I begin, let me stress that I’m discussing generalities of how the stock market behaves. As you read this, I urge you to focus on the larger themes I’m discussing instead of getting bogged down in nitpicky details or in excessive demands for precision. Out of necessity, my explanation is over-generalized.
The first thing to understand is that the stock market is overwhelmingly influenced by interest rates. It’s difficult to overstate this key fact. Interest rates are the bone and marrow of the stock market. More specifically, the stock market is ruled by long-term and short-term interest rates. Of the two, long-term rates are more influential.
When the bond market rises, the stock market eventually follows. When the bond market falls, the stock market isn’t far behind. The two assets are in constant battle for investors’ love. Their perpetual tug-of-war is at the heart of financial markets. Short-term rates are also important, and that’s why the Federal Reserve is so closely watched.
The movement of short-term and long-term rates also determines which types of stocks do well. When long-term interest rates rise, cyclical stocks tend to outperform the overall market. When long-term rates fall, defensive stocks tend to lead the market. Importantly, this is a short-term relationship that grows weaker as time wears on.
With short-term rates, we see a similar but slightly different effect. When short-term rates fall, value stocks tend to outperform the market. When short-term rates rise, growth stocks tend to do well.
These are the two primary “dimensions” of the stock market (Cyclical/Defense, Value/Growth). These categories have some similarities, and they’re easily confused, but I want to highlight their differences. The Cyclical/Defense divide is fought over the future of the production part of the economy. Are we producing more than we’re consuming, or consuming more than we produce? The Value/Growth divide is about the financial part of the economy. How much inflation will there be, and what are real rates doing?
By Cyclical stocks, I mean stocks in sectors like Energy and Materials which are closely tied to the economic cycle. The Defensive sectors are Staples and Healthcare, which are areas that aren’t so hurt in downturns.
The value stocks are generally in high-dividend areas like REITs and Utilities. As short-term rates drop, investors naturally gravitate towards those dividends. The growth sector stocks tend to be in low-dividend areas like Tech and more inflation-sensitive sectors like Commodities and Gold Mining.
As I said, these two dimensions are related. They’re cousins in much the same way that short-term and long-term yields are cousins. Now with this background, let’s envision the market as a matrix with short-term rates on the horizontal axis and long-term rates on the vertical.
You can probably see where I’m going with this. We now have four quadrants. The upper right is when both long-term and short-term rates are rising. The lower left is when both ends are falling. The lower right is when short-term rates are rising and long-term rates are falling. In other words, the yield curve is getting narrower. The upper left is the opposite; the yield curve is getting wider.
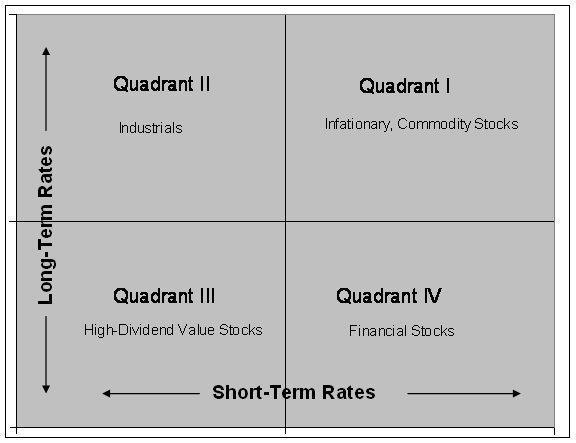
When long and short rates both rise, inflationary stocks do well. When both rates fall, dividend stocks do well. When the yield curve narrows, financial stocks do well. When the yield curve widens, industrial stocks do well. Importantly, we’ll also see that when a particular quadrant behaves one way, one of its opposing quadrants will do the exact opposite. Earlier this year, for example, growth started to lag right as value started to shine.
Let me add a clarification. It may be the case that industrial stocks lead the market, not when short-term and long-term rates are literally moving in the opposite direction, but when the spread is increasing. What the market is concerned with is the relative standing of short and long rates against each other. Not that long ago, 4% was a very low yield; now it’s very high.
It may sound counter-intuitive that financial stocks do well as the yield curve narrows. After all, a bank is basically the yield curve with incorporation papers. In the same way that lower short-term rates are good for dividend stocks, it’s the closing of the yield curve that causes investors to appreciate financial stocks.
With the four quadrants, the general stock market moves counter-clockwise around the matrix. First, short-term rates fall as the Fed tries to help the economy; then long-term rates start to fall; and finally the stock market takes off. Things are rarely so neat, but this pattern played itself out in 1981-82.
In the late stages of an economic expansion, short-term rates are the first to rise as the Fed wants to control inflation; then long-term rates will move up; and eventually the stock market breaks down. That’s how 1986-87 went. In the latter stages of that rally, dividend stocks badly lagged the market, while gold mining raced ahead. In essence, investors were fleeing safe assets.
On the matrix, the stock market will start to rally around 11 o’clock and continue counter-clockwise towards its peak around 5 o’clock. That’s why cyclical stocks tend to have a double-whammy effect; they outperform the market during bull markets. Hence the name cyclicals.
Bear in mind that few stocks are pure breeds of any one quadrant. Typically, they have mixed DNA. For example, a stock like Chevron is a classic energy stock, but it also pays a generous dividend. You’ll also see healthcare stocks, which are classic defensive stocks, that are partly related to tech stocks.
As I mentioned before, these classifications are most important in the short term. As time goes on, the part of any stock which reflects its individual nature will become more prominent. Each day, two biotech stocks may track each other closely, but after five years, they can be miles apart. The more times that passes, the stronger this effect is.
The idea that different sectors do better or worse at different points in the economic cycle is nothing new. It’s been pointed out many times before. The Elfenbein Theory, however, is a way for investors to see an overriding framework for what drives this behavior.
(You can sign up for my free newsletter here.)
Copyright © Eddy Elfenbein