August 21, 2013
by Kathy A. Jones, Vice President, Fixed Income Strategist, Schwab Center for Financial Research
Key Points:
- The press has been comparing this year to 1994—one of the worst years in the fixed income market. We believe a more accurate historical comparison is the post-World War II period.
- During the post-World War II era, the Fed engaged in a series of extraordinary policy measures—much like it is doing today.
- What did we learn? Investors waiting for long-term bond yields to rebound may be in for a long wait, based on past history.
It is often said that history doesn't repeat, but it rhymes. The recent sell-off in long-term bonds has led to predictions that this year will be a repeat of 1994—one of the worst years for the fixed income market in the past 40 years. Indeed, there are similarities that could support that interest rate outlook. In both years, the markets sold off in response to signs that the Fed was shifting toward a tighter monetary policy stance. In 1994, the total return on the Barclay's Aggregate Bond Index was -2.9%. For 2013 to date, the total return on this same index is -2.2%.
Differences outweigh similarities
However, in 1994, economic growth was much stronger. The Fed began to tighten policy in response to inflation concerns generated by strong consumer borrowing and tighter supplies of materials and labor. Unemployment was lower (6.6% compared to 7.4% today). In addition, the fixed income markets, especially the market for mortgage-backed securities, were highly leveraged. Plus, the Federal Reserve gave no warning that it was about to double the Fed funds rate.
This year has been quite different. The economy, both domestically and globally, is growing at a much slower pace; inflation is lower and trending down. The Fed is not raising short-term interest rates and is, in fact, still easing policy by continuing to buy bonds under the quantitative easing (QE) program. The mortgage-backed securities market is not nearly as leveraged since the Fed owns about 25% of outstanding mortgage-backed securities. Perhaps most importantly, the Fed is much more transparent about signaling policy changes now than it was 20 years ago, giving investors more clues about the interest rate outlook. We believe there's not much indication here that 1994 will repeat, or even rhyme.
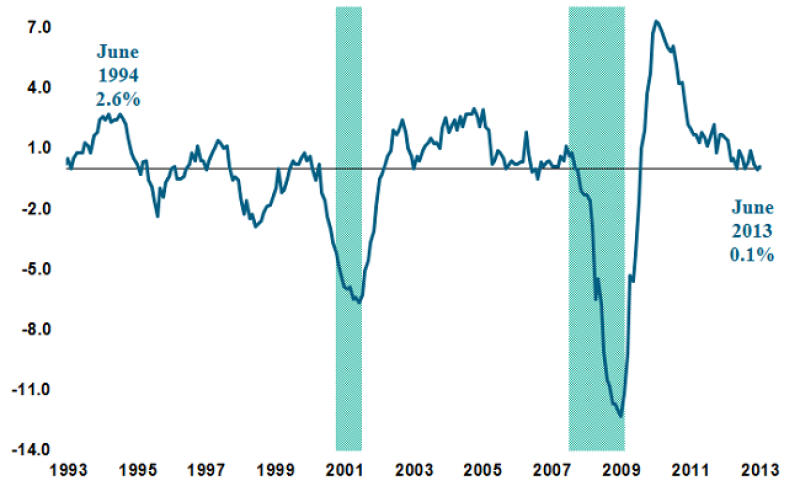
Capacity utilization: Total industry
Source: St. Louis Federal Reserve. Capacity Utilization: Total Industry (TCU), Change from Year Ago, Percent of Capacity, Monthly, Seasonally Adjusted. Data as of June 2013.
Total consumer credit owned and securitized, outstanding
Source: St. Louis Federal Reserve. Total Consumer Credit Owned and Securitized, Outstanding (TOTALSL), Percent Change from Year Ago, Monthly, Seasonally Adjusted. Data as of June 2013.
There is, however, an historical comparison that may provide some insight into the current interest rate outlook: the post-World War II era of the 1940s and 1950s. Not only are bond yields and inflation in the same general vicinity today as back then, but there are other similarities, particularly in terms of Fed policy.
Just after World War II, the Fed coordinated policy with the Treasury to hold down interest rates in order to help finance the huge federal debt left over from the war. The Fed absorbed much of the supply of bonds on the market and held short-term interest rates near zero. Worried about potential bank failures, the Fed focused on maintaining an "orderly market," which translated into a great deal of flexibility in terms of policy. Inflation fears were widespread and there was internal disagreement at the Fed about whether it was pursuing the right policy. Sound familiar?
Setting the stage
During World War II, the Federal government debt expanded sharply. By 1946, the ratio of total public debt to GDP was 122%. (Today, this ratio stands at about 105% of GDP.)
In the 1940s, the Treasury wanted to keep government borrowing costs low to finance the war. The Federal Reserve was pressed to buy government bonds in order to hold down interest rates. In 1942, T-bill rates were formally capped at 0.38% and the discount rate was set at no more than 1.5% by the Fed.
Long-term rates were also effectively capped at 2.5% by the Fed purchasing securities "as may be necessary" for maintaining yields of government securities at "the present level." The Fed's holdings of Treasuries rose from about 4% of GDP in 1929 to above 20% by 1940. (Today, the Fed's holdings are about 22% of GDP; they were about 6% prior to the financial crisis.)
US Federal Reserve banks' holdings of securities as a percentage of US nominal GDP (%)
Source: Federal Reserve Board and St. Louis Federal Reserve, Gross Domestic Product (GDPA), Billions of Dollars, Annual, not seasonally adjusted. Shaded areas indicate past recessions. Data as of January 8, 2013.
Post war
After the war ended, Fed officials were very concerned about inflation and pushed the Treasury to allow it to raise interest rates. Inflation soared to as high as 25% as soldiers returned and drove up consumption and prices. Price and wage controls were still in place but once they were gradually rolled back starting in 1946, inflation became a problem.
In 1948, the Treasury agreed to allow a higher range of interest rates and the Fed proceeded to sell some of the bonds from its portfolio. However, despite the Fed's selling, long-term interest rates didn't rise above 2.5%. Tight credit conditions led to a mild recession and inflation eventually turned to deflation of about 3%. Interest rates remained low despite these wide fluctuations in inflation.
Fed reasserts its independence
In the 1950s, inflation became a concern again due to the Korean War. After much negotiation, the Treasury and the Fed reached an agreement in 1951 that allowed the Fed to function independently again.
The Fed subsequently raised short-term interest rates. But yields on long-term bonds only rose to 2.75%. Why? Economists Milton Friedman and Anna Schwartz, along with Glen Hubbard and Christina Romer, asserted that it had to do with inflation expectations. In their academic work, they theorized that the Fed's credibility about its inflation-fighting potential helped keep interest rates low. In other words, if the market believes the Fed is prepared to sell bonds from its portfolio to contract the money supply and limit inflation pressures, it won't force the Fed to sell the bonds to control inflation.
There are, of course, substantial differences between the post-World War II era and today. The banking sector has undergone substantial deregulation in the past twenty years, which may make it more difficult for the Fed to restrain lending when the economy picks up. In addition, the US economy is far more integrated with the global economy. The US dollar is free-floating and a substantial proportion of investors in the US treasury market are foreign. Because the United States is a net foreign debtor, confidence abroad is a significant factor in the direction of interest rates. Finally, reducing the US debt to GDP ratio may prove harder today than in the post-war period, when the country's potential growth rate was much higher.
Nonetheless, we think there are lessons to be learned from the extraordinary Fed policy actions following World War II. These lessons may run counter to some of the popular perceptions about the imminent risks of higher interest rates.
What does the post-World War II period tell us about today?
- The Fed's withdrawal of QE may not cause interest rates to move up as soon or as much as most people fear. Credible Fed policy and "well-anchored" inflation expectations may be more important than the size of the Fed's balance sheet.
- The Fed may be able to hold bonds on its balance sheet for a long time without causing inflation. It did not have to liquidate its holdings quickly in the 1950s. As a result, there weren't any sudden spikes in yields as the market tried to absorb the supply.
- Fed policy can be flexible for a long time and in many ways. In the post-war era, the Fed continued to buy bonds as needed to maintain "orderly conditions" in the market. It also managed duration on the balance sheet by exchanging long-term bonds for non-marketable bonds redeemable at the holder's option before maturity by conversion to a five-year marketable Treasury. (Are there Treasury swaps in our future?)
- Anchoring short-term interest rates near zero can have a powerful effect on long-term rates. The discount rate was held at 1.75% until January 1953 and didn't exceed 2% until 1955. This policy helped keep 10-year bond yields under 3% until 1956.
Bond yields were slow to rise following the low set during World War II
Source: Source: St. Louis Federal Reserve. Long-Term U.S. Government Securities (DISCONTINUED SERIES) (LTGOVTBD), Percent, Monthly, Not Seasonally Adjusted.
Perhaps 2014 will be more like 1954 than 1994. In 1954, interest rates rose in response to concerns about inflation, but soon fell back below 2.5%. Instead of a rapid rise in rates, it could take a long time for bond yields to rise significantly. Looking at the chart above, you can see that bond yields didn't rise to the high of 4%, seen prior to the war, until the early 1959—eighteen years after the low in 1941.
10-Year Treasury yields: 2007-2013
Source: St. Louis Federal Reserve. 10-Year Treasury Constant Maturity Rate (GS10), Percent, monthly, Not Seasonally Adjusted. Shaded areas indicate past recessions. Data as of August 13, 2013
Next steps
Investors waiting for long-term bond yields to rebound to levels seen prior to the start of the Fed's extraordinary monetary policy moves in 2008 should consider that they may have a longer wait than they anticipated, based on past history. Instead of trying to time a move in interest rates, we suggest investors consider using bond ladders or invest in high-quality, intermediate-term bonds that will continue to generate income as the Fed begins to normalize interest rates.
****
Important Disclosures
Fixed-income securities are subject to increased loss of principal during periods of rising interest rates. Fixed-income investments are subject to various other risks including changes in credit quality, market valuations, liquidity, prepayments, early redemption, corporate events, tax ramifications and other factors.
Past performance is no guarantee of future results.
The information provided here is for general informational purposes only and should not be considered an individualized recommendation or personalized investment advice. The investment strategies mentioned here may not be suitable for everyone. Each investor needs to review an investment strategy for his or her own particular situation before making any investment decision.
All expressions of opinion are subject to change without notice in reaction to shifting market conditions. Data contained herein from third-party providers are obtained from what are considered reliable sources. However, accuracy, completeness or reliability cannot be guaranteed.
The Barclays U.S. Aggregate Index represents securities that are SEC-registered, taxable, and dollar denominated. The index covers the U.S. investment grade fixed rate bond market, with index components for government and corporate securities, mortgage pass-through securities, and asset-backed securities. These major sectors are subdivided into more specific indices that are calculated and reported on a regular basis.
Thumbs up / down votes are submitted voluntarily by readers and are not meant to suggest the future performance or suitability of any account type, product or service for any particular reader and may not be representative of the experience of other readers. When displayed, thumbs up / down vote counts represent whether people found the content helpful or not helpful and are not intended as a testimonial. Any written feedback or comments collected on this page will not be published. Charles Schwab & Co., Inc. may in its sole discretion re-set the vote count to zero, remove votes appearing to be generated by robots or scripts, or remove the modules used to collect feedback and votes.
Copyright © Schwab.com