


by Don Vialoux, TechTalk
Upcoming US Events for Today:
- ADP Employment Report for May will be released at 8:15am. The market expects 171,000 versus 119,000 previous.
- Productivity for the First Quarter will be released at 8:30am. The market expects a quarter-over-quarter increase of 0.7%, consistent with the previous report. Unit Labor Costs are expected to increase by 0.5%.
- Factory Orders for April will be released at 10:00am. The market expects a month-over-month increase of 1.4% versus a decline of 4.0% previous.
- ISM Services for May will be released at 10:00am. The market expects 53.8 versus 53.1 previous.
- Weekly Crude Inventories will be released at 10:30am.
- The Fed’s Beige Book for June will be released at 2:00pm.
Upcoming International Events for Today:
- India PMI Services will be released at 1:00am EST.
- German PMI Services for May will be released at 3:55am EST. The market expects 49.8 versus 49.6 previous.
- Euro-Zone PMI Services for May will be released at 4:00am EST. The market expects 47.5 versus 47.0 previous.
- Great Britain PMI Services for May will be released at 4:30am EST. The market expects 53.0 versus 52.9 previous.
- Euro-Zone GDP for the First Quarter will be released at 5:00am EST. The market expects a year-over-year decline of 1.0% versus a decline of 0.6% previous.
- Euro-Zone Retail Sales for April will be released at 5:00am EST. The market expects a year-over-year decline of 0.6% versus a decline of 2.4% previous.
- Canada Building Permits for April will be released at 8:30am EST. The market expects a month-over-month decline of 2.3% versus an increase of 8.6% previous.
- Australia Trade Balance for April will be released at 9:30am EST. The market expects 180M versus 307M previous.
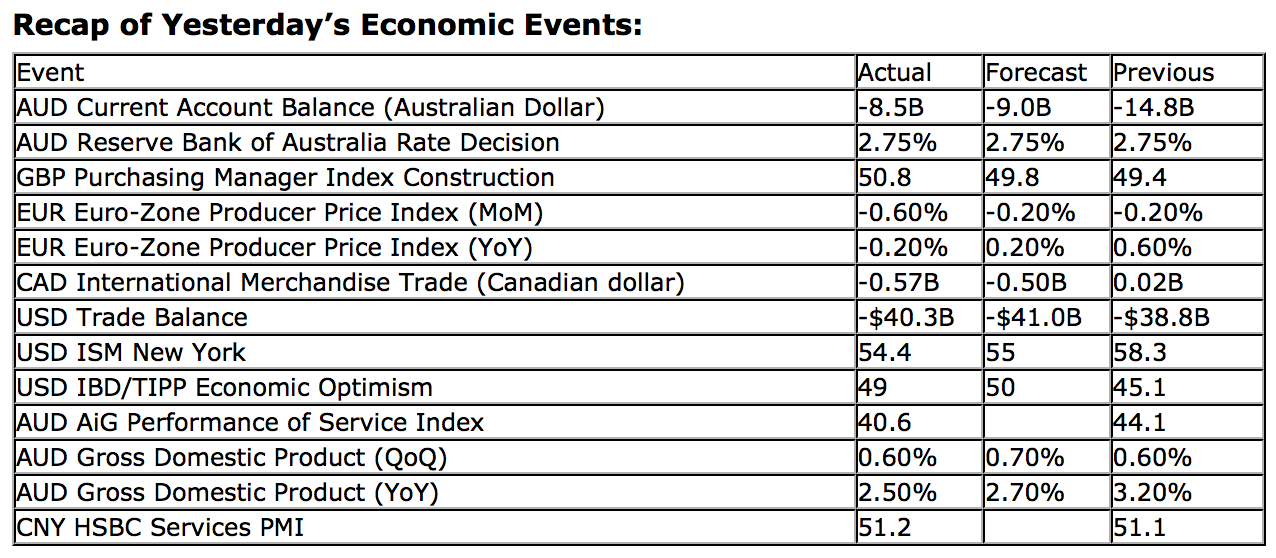
Recap of Yesterday’s Economic Events:
The Markets
Equities traded lower on Tuesday, bringing an end to 20 consecutive Tuesday’s of positive results for the Dow Jones Industrial Average. Concerns pertaining to the Fed tapering its bond buying program led the stock market selloff, pushing the Dow almost 1% lower by midday. The remainder of the week will only fuel further speculation as to what the Fed might do as employment reports for the month of May are released; ADP will release their report this morning at 8:15 followed by the BLS report on Friday. Disappointing results may actually garner a positive reaction as the perception would become that the present easy monetary policy will remain intact. Vice versa if the results are strong. Talk of tapering has had a significant effect on yields over the past month. The 10-year note has jumped from around 1.6% to as high as 2.2%, testing the upper limit of a rising trendline that stretches back to last summer. The 200-day moving average of the yield has now curled higher for the first time since early 2011, implying positive momentum over a long-term scale. This trend is contradictory to seasonal averages. Typically yields trend lower throughout the summer months as equity market volatility forces investors into safe-haven assets. Bonds and interest sensitive plays that typically flourish in the summer may experience some volatility themselves.

The recent weakness in the S&P 500 has triggered momentum “Sell” signals with respect to RSI, MACD, and Stochastics. The percent of stocks within the large-cap index trading above 200-day moving averages is also offering a signal that suggests caution is warranted. The percent recently topped 90 (94 to be exact), a level in which significant market peaks have been known to form. The percent is now attempting to push below its 50-day moving average line, a level that has typically provided reliable sell signals for equity market positions. The break below the 50-day moving average line is so far just marginal and more evidence is required to confirm the signal, but downside risks are escalating.

Seasonal charts of companies reporting earnings today:


Sentiment on Tuesday, as gauged by the put-call ratio, ended bearish at 1.16.

S&P 500 Index

Chart Courtesy of StockCharts.com

TSE Composite

Chart Courtesy of StockCharts.com

Horizons Seasonal Rotation ETF (TSX:HAC)
- Closing Market Value: $13.33 (up 0.08%)
- Closing NAV/Unit: $13.29 (down 0.09%)
Performance*
| 2013 Year-to-Date | Since Inception (Nov 19, 2009) | |
| HAC.TO | 4.49% | 32.9% |
* performance calculated on Closing NAV/Unit as provided by custodian
Click Here to learn more about the proprietary, seasonal rotation investment strategy developed by research analysts Don Vialoux, Brooke Thackray, and Jon Vialoux.

Copyright © TechTalk


