Looking South of the Border
Seeking U.S. Equity Exposure through ETFs
Alfred Lee, CFA, CMT, DMS
Vice President, BMO ETFs
Portfolio Manager & Investment Strategist
BMO Asset Management Inc.
www.bmo.com/etfs
June 4, 2013
Recent Developments:
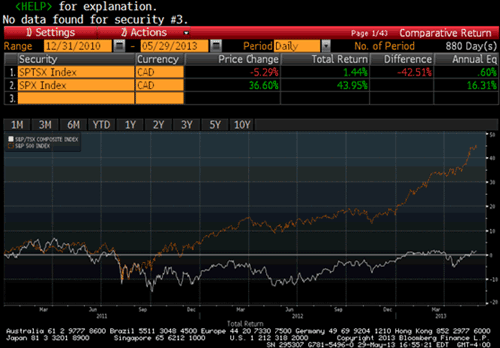
- Since the beginning of 2011, when we made the recommendation to overweight U.S. equities, the 44.0% total return of the S&P 500® Composite Index (SPX) (in Canadian dollars) has easily outperformed the 1.4% total return of the S&P/TSX Composite Index (S&P/TSX) – (Chart A). From a fundamental perspective, we continue to favour U.S. equities given that the 16.1x current price-to-earnings (P/E) ratio of the SPX is still at a 34.2% discount to its 2009 high. In comparison, the 16.3x forward P/E ratio of the S&P/TSX is at a 23.4% discount to its 2009 high.
- As investors are aware, the S&P/TSX is heavily concentrated in sectors that are highly sensitive to global economic growth. For instance, the energy and material sectors together currently make up close to 40% of the S&P/TSX. With many emerging markets focusing on internalizing their economic growth, and relying less on infrastructure related projects to stimulate their economies, commodity related areas will likely continue to face headwinds. The material sector has had a total return of -23.9% year-to-date, by far the worst performing sector of the S&P/TSX. While the 6.0% total return of the energy sector is more than the 3.7% total return of the S&P/TSX year-to-date, it is the third worst performing sector of the S&P/TSX over the period.
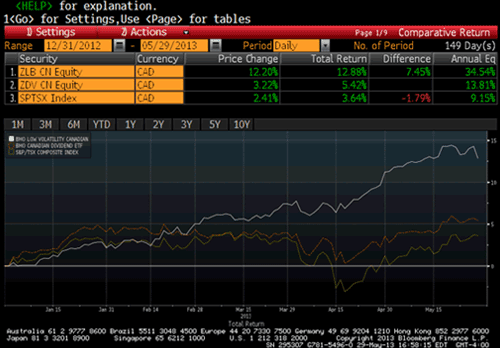
- For Canadian equity exposure, we continue to recommend low volatility ETFs such as the BMO Low Volatility Canadian ETF (ZLB) and/or dividend related ETFs such as the BMO Canadian Dividend ETF (ZDV), given their lower weights to cyclical oriented areas – (Chart B). Over the long-term, we remain favourable on U.S. equities, but indicators such as the Relative Strength Indicator (RSI), a technical measure we use for shorter-term price momentum, suggest U.S. equities to be short-term overbought. Given we remain favourable on U.S. equities over the long-term, should the market experience a short-term pull-back, exchange traded funds (ETFs) can be used to efficiently gain exposure to U.S. equities. For alternatives in which BMO ETFs investors can use to get U.S. equity exposure, please see below.
Investment Idea:
- Investors can easily access U.S. equities through traditional indices such as the S&P 500 Composite Index (SPX), the Dow Jones Industrial Average (Dow) and the NASDAQ-100 Index (NDX) which a number of BMO ETFs track. For the broad based SPX, investors have several alternatives including the S&P 500 Index ETF (ZSP), which is also available in U.S. dollar units (ZSP.u) and in a currency hedged format through the BMO S&P 500 Hedged to CAD Index ETF (ZUE). Investors looking for U.S. blue chip companies can utilize the BMO Dow Jones Industrial Average Hedged to CAD Index ETF (ZDJ), which tracks the multinational oriented Dow. Those investors preferring a heavier exposure to technology may prefer the BMO NASDAQ 100 Equity Hedged to CAD Index ETF (ZQQ), which tracks the NDX.
- Investors that seek a dividend oriented approach to U.S. equity investing, may want to consider the BMO U.S. Dividend ETF (ZDY), which is also available in U.S. dollar units (ZDY.u) and a currency hedged version through the BMO U.S. Dividend Hedged to CAD ETF (ZUD). This ETF screens for stocks that have a flat or growing dividend payout over the last three years and also companies that have a sustainable payout ratio.
- Investors that prefer a more defensive approach to U.S. equity investing may consider the BMO Low Volatility U.S. Equity ETF (ZLU), which is also available in U.S. dollar units (ZLU.u). This unique ETF screens for U.S. stocks that have a low beta. Beta measures a security's sensitivity to market movements, the lower the beta, the less sensitive a security to equity market movements. The portfolio contains 100 low beta stocks, with those stocks that are less sensitive or with the lowest beta having a higher weighting in the ETF.
- For a complete look at our current portfolio positioning ideas using ETFs, please see our second quarter BMO ETF Portfolio Strategy Report.
Chart A: U.S. Equities Have Rallied While Canadian Equities Have Stalled

Chart B: Low Beta and Dividend ETFs Have Outperformed the S&P/TSX Composite

For additional information, please visit our website at www.bmo.com/etfs
For questions, please contact:
Investor Contact:
Client Services: 1-800-361-1392
Advisor Contacts:
Kevin Prins
Vice President, Ontario
kevin.prins@bmo.com
Daniel Stanley
Vice President, Ontario
daniel.stanley@bmo.com
Alain Desbiens
Vice President, Quebec & Atlantic
alain.desbiens@bmo.com
Mark Webster
Vice President, Western Canada
mark.webster@bmo.com
*All prices and yield figures as of market close May 29, 2013 unless otherwise indicated.
Information, opinions and statistical data contained in this report were obtained or derived from sources deemed to be reliable, but BMO Asset Management Inc. does not represent that any such information, opinion or statistical data is accurate or complete and they should not be relied upon as such. Particular investments and/or trading strategies should be evaluated relative to each individual's circumstances. Individuals should seek the advice of professionals, as appropriate, regarding any particular investment.
BMO ETFs are managed and administered by BMO Asset Management Inc, an investment fund and portfolio manager and separate legal entity from the Bank of Montreal. Commissions, management fees and expenses all may be associated with investments in funds. Please read the prospectus before investing. The indicated rates of return are the historical annual compound total returns including changes in prices and reinvestment of all distributions and do not take into account commission charges or income taxes payable by any unit holder that would have reduced returns. Exchange traded funds are not guaranteed, their value changes frequently and past performance may not be repeated.
"S & P®", "S & P 500®" and "S & P/TSX Capped Composite™" are trade-marks of S & P Opco, LLC and "TSX" is a trade-mark of TSX Inc. These and other associated trade-marks and/or service marks have been licensed for use by BMO Asset Management Inc. None of the BMO ETFS are sponsored, endorsed, sold or promoted by any of its aforementioned trade-mark owners and the related index providers or their respective affiliates or their third party licensors and these entities make no representation, warranty or condition regarding the advisability of buying, selling or holding units in the BMO ETFs.
The Dow Jones Industrial AverageSM is a product of Dow Jones Opco, LLC, ("Dow Jones Opco"), a subsidiary of S&P Dow Jones Indices LLC and has been licensed for use. "Dow Jones®" and "Dow Jones Industrial AverageSM" are service marks of Dow Jones Trademark Holdings, LLC ("Dow Jones") and have been licensed to Dow Jones Opco for use for certain purposes. BMO ETFs based on Dow Jones indexes are not sponsored, endorsed, sold or promoted by Dow Jones Opco, Dow Jones or their respective affiliates, and Dow Jones Opco, Dow Jones and their respective affiliates make no representation regarding the advisability of trading in such product(s).
Nasdaq®, OMX®, NASDAQ OMX®, Nasdaq-100®, and Nasdaq-100 Index®, are registered trademarks of The NASDAQ OMX Group, Inc. (which with its affiliates is referred to as the "Corporations") and are licensed for use by BMO Asset Management Inc. The BMO Nasdaq 100 Equity Hedged to CAD Index ETF has not been passed on by the Corporations as to its legality or suitability and is not issued, endorsed, sold, or promoted by the Corporations. THE CORPORATIONS MAKE NO WARRANTIES AND BEAR NO LIABILITY WITH RESPECT TO The BMO Nasdaq 100 Equity Hedged to CAD Index ETF.


