Below we provide our trading range charts for four key commodities. In each chart, the green shading represents between two standard deviations above and below the 50-day moving average, and moves above or below the green shading are considered overbought or oversold.
As shown, natural gas is now right at overbought territory, while oil is close to oversold territory. No, that's not a misprint, natural gas really is at overbought territory, while oil is close to oversold territory.
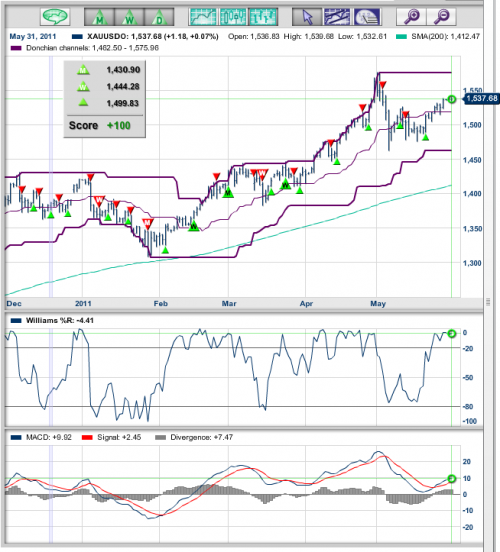
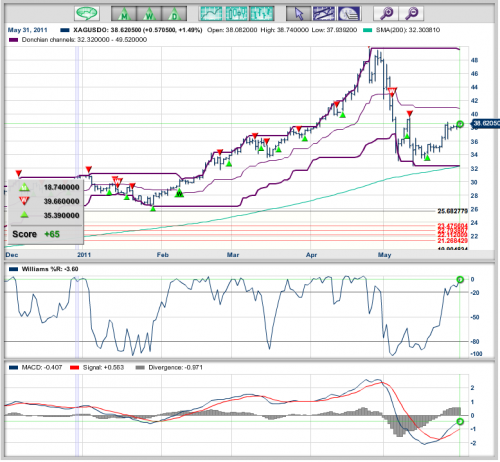
Gold is also now close to overbought territory once again as it closed the week above $1,530. After the sharp pullback silver saw earlier this month, it has made a decent recovery as well.

The rally in commodities to close out the week coincided with a pullback in the dollar. The US Dollar index broke above its 50-day moving average a couple of weeks ago, and it was even close to breaking its long-term downtrend as we noted earlier in the week. Thoughts of the long-term downtrend coming to an end proved to be wishful thinking, however, and the Dollar index finished off the week back below its 50-day.
[AA] According to MarketClub's technical indicators, gold is in a solid uptrend, with all three of their trade triangles pointing upward. The monthly triangle signalled in at $1,430.90, the weekly triangle turned on at $1,444.28 and the daily triangle turned on at $1,499.83. The Williams%R indicator says that gold is in overbought territory, and the MACD indicates accumulation. Currently, at the time of this chart, gold was trading at 1,537.68.
Silver shows an uptrend (+65), up 8.3% last week, following the substantial sell-off in the wake of margin requirements being raised. With the monthly (18.74) and daily (35.39) triangles, green, the near term weekly triangle (which turned red at 39.66) is set to turn green, as the price of silver nears the Donnchian channel (purple channel lines) mid-point, and MarketClub's Adam Hewison says that silver could reach up into the low 40s in the short term. Williams%R took off into the overbought zone at the end of last week, and the MACD shows a solid divergence in favour of accumulation.
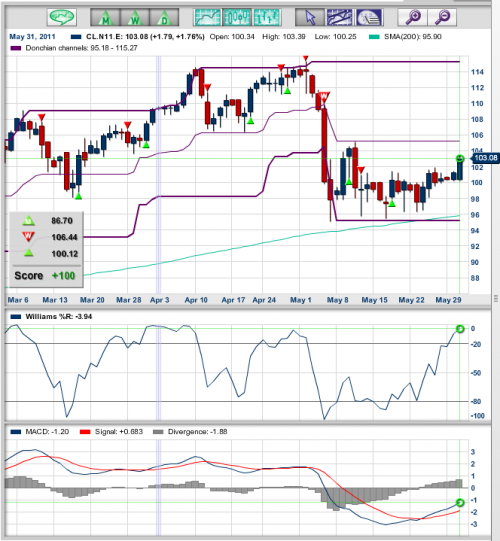
Oil too, is experiencing a strong recovery, in the wake of the selloff in early May, and shows a solid uptrend (+100), and monthly and daily MarketClub trade triangles green, and the Weekly triangle still red, having turned so at 106.44. Had you been in crude before the selloff, the effective red weekly sell triangle was loss minimizing.
Williams%R indicates oil is overbought, however, MACD indicates divergence in favour of accumulation.
[AA]

Copyright © Bespoke Investment Group


