Sector Weights: On Average Wrong, But Dynamically Right
by John West, Research Affiliates
In Marcel Duchamp’s famous 1912 painting, Nude Descending a Staircase, No. 2, the French painter captured the sense of motion by illustrating a series of images— all displayed in one frame.1 The controversial painting was inspired by Cubism’s breakdown of familiar images into multiple perspectives. But it went one better than the Cubists—who typically used static images—by adding motion, reflecting the influence of the nascent motion picture industry.2 The painting forced the observer to rethink how he or she viewed art.
Similarly, the Fundamental Index® methodology forces investors to rethink how they view portfolio returns. Investors typically dissect returns, trying to understand how much of performance is attributable to sector bets and how much to stock selection. Like Cubists, they are deconstructing reality and then putting it back together. But what if we—like Duchamp—add motion to the picture?
We are commonly asked why the Fundamental Index methodology overweights and underweights certain sectors. What’s the rationale? Why does the strategy “like” this sector or that sector? In recent years, the methodology has overweighted financials and underweighted energy, leading a rational person to conclude that holding such wrong weights surely caused performance problems. In this issue, we show such structural sector bets, in fact, don’t matter over the long term. Indeed, the Fundamental Index strategy can be wrong on average but right in the long run because of its ability to contra-trade against market fads, crashes, bubbles, and speculation. Investors need to look at the movement embodied in such strategies—not just their average holdings over a period in time.
Contra-Trading—The Great Equalizer
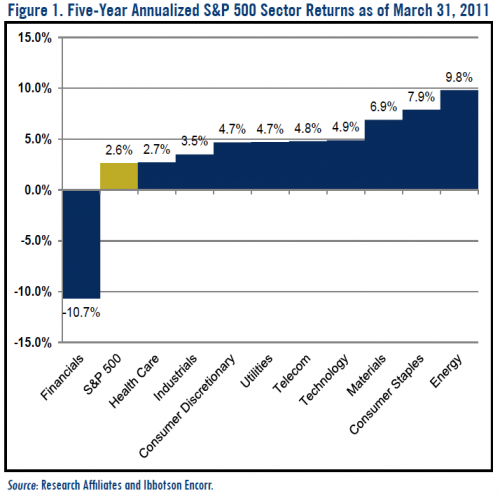
The markets have been through an extraordinarily volatile period the past five years, beginning with strong equity returns in 2006–2007, followed by the Global Financial Crisis (GFC) in 2008, and the subsequent Mother of All Recovery rallies in 2009–2010. Talk about a full market cycle! Within this period, sector returns have varied widely as evidenced in Figure 1.
During this period, energy and financial stocks have experienced dichotomous lives. Energy stocks jumped 10% per year and led all sectors of the market. Meanwhile, the GFC pounded financial stocks. To be fair, some financial institutions caused the GFC and were punished accordingly with the sector losing over 10% per annum. Indeed, financial stocks were the only sector to actually lose money and the only sector to underperform the S&P 500 Index during this time span. The other nine sectors all outperformed the broad market.
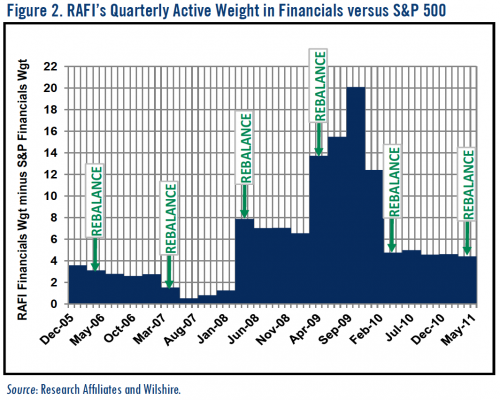
The FTSE RAFI® US 1000 held an average weighting of 24% in financials since it went live in November 2005, compared with the S&P 500’s average weighting of 18%. In other words, the Fundamental Index concept held an average overweight of 6%. Uh-oh. At one point in this cycle, financials registered the worst performing oneyear period for any sector going back to 1989,3 even worse than technology stocks after the collapse of the TMT bubble. With the RAFI strategy’s sizable overweight to the lone absolute and relative loser of the last five years, a logical expectation would be a big shortfall in RAFI’s performance relative to cap-weighting. In reality, the FTSE RAFI US 1000 beat the S&P by 2.3% per year, similar to the excess return as published in the original research!4
This counterintuitive result provides a good example of how the Fundamental Index concept adds value through the contra-trading embedded into the annual rebalance back to fundamental weights—that is, back to the economic footprint of the constituent companies. Figure 2 shows the FTSE RAFI US 1000’s relative financial weights (in other words, the active sector bet versus the S&P 500). Financials had a slight overweight in the FTSE RAFI US 1000 until the March 2008 rebalance, when the strategy took on an 8% overweight after bank share prices began to fall in summer 2007. In March 2009—six months after Lehman Brothers Holdings’ spectacular collapse and changes that forever changed the face of the financial services industry—financials were again rebalanced back to their fundamental weights of 25% (versus 11% for the S&P). Then the sector—left for dead in early 2009—took off. The financials weight of the FTSE RAFI US 1000 reached almost 20% more than the respective S&P 500 weight in fall 2009. As bank prices rebounded strongly, the March 2010 rebalancing witnessed a trimming of financial weights back to their fundamental scale. All told, the RAFI strategy made profits in spite of a large overweight in a sector that would have lost half its value if the weight had not been adjusted from March 2006.
There’s a lesson here. The Fundamental Index approach isn’t designed to “pick” winning sectors (or even stocks). Rather, the methodology succeeds by breaking the link between stock price and portfolio weight. A price-indifferent approach like the Fundamental Index strategy makes the link between pricing errors and portfolio weights random, not structural. The expected result? Half the portfolio winds up in overpriced stocks and half in underpriced stocks. The errors cancel.
But don’t take our word for it. Equal-weighted indexes break the link between price and weight and provide the same automated rebalancing as the Fundamental Index methodology (with a far less scalable and tougher to implement portfolio). Yet equal-weighting has had a substantial underweight to energy stocks. Why? Because the energy sector is narrow—a few mega-cap integrated oil companies dominate.5 There are only 40 stocks in the energy sector in the S&P 500; at a 0.2% weight for each, that creates an 8% target weight in the equal-weighted index. In contrast, the cap-weighted S&P 500 has a 12% weight in energy stocks, led by Exxon Mobil at nearly 3.5%, followed by very large weights in Chevron, Schlumberger, and ConocoPhillips. In spite of a large underweight in top-performing energy stocks, the S&P 500 Equal Weighted Index beat the cap-weighted S&P 500 over the last five years by the same margin that FTSE RAFI did: 5.2% versus 2.9%.6 Two independent non-price-weighted indexes—one with a huge overweight to the worst performing sector and one with a sizeable underweight to the best performing sector—beat the cap-weighted S&P 500 by more than 2%.
Conclusion
When Duchamp made art history with his notorious nude, he adopted Cubist ideas about deconstructing ideas while mocking its pretensions. He deconstructed images methodologically, but added motion and a jocular title painted along the bottom of the picture. In fact, Paris’s Salon des Independents rejected the work because the jury believed that Duchamp “was poking fun at Cubist art.”7 In reality, he laid the foundation for two new art movements: Futurism and Dadaism.
Our story is less controversial, but the idea of examining an idea—whether it’s art or investment returns—from multiple perspectives is important. We are often asked why the RAFI strategy is taking “bets” in certain sectors. The answer is the RAFI strategy’s average sector bets just don’t matter. The Fundamental Index methodology doesn’t need structural (static) sector bets to succeed. In fact, the approach can succeed even when making “wrong” structural sector bets as we have seen with financials and energy during the GFC. All the Fundamental Index methodology needs to provide excess returns over the cap-weighted index is market volatility that inevitably occurs when investor ebullience or capitulation lead to mean reversion of security prices.
The author wishes to thank Joel Chernoff, our resident art historian, and Ryan Larson, our analyst without compare, for their substantial contributions.
Endnotes
1. See http://www.philamuseum.org/collections/permanent/51449.html.
2. See http://www.understandingduchamp.com/text.html.
3. The S&P 500 Financials returned -70% for the one-year period ending February 28, 2009; the next worst one-year return was -63% for S&P 500 Technology for the 12-month period ending September 30, 2001.
4. See Arnott, Hsu, and Moore (2005).
5. This lack of representativeness is another drawback to the equal-weighting approach.
6. We chose energy because it was the best performing sector and was a very large underweight by equal-weighting. However, the story was seen across the portfolio. Of the best four sectors that drove positive results in
the period, equal-weighting was underweight in three. Also, equal-weighting was neutral in weight in financials, meaning it derived no benefit in that sector. In total, the S&P Equal Weighting Index was unfavorably
positioned on a structural sector basis, yet beat the S&P handily.
7. See http://www.understandingduchamp.com/text.html.


