by Ryan Detrick, LPL Research
A year ago yesterday marked the first new all-time closing high for the S&P 500 Index in nearly 14 months. As we noted at the time, that first new high after at least a year can kick off a strong period of outperformance for equities. Sure enough, the S&P 500 has made 42 new highs and is up 14% over the past year.
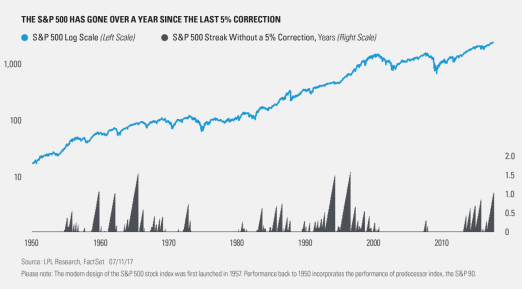
But, the amazing performance over the past twelve months doesn’t stop there as the index incredibly hasn’t pulled back at least 5% (on a closing basis) over that period. Per Ryan Detrick, Senior Market Strategist, “This is only the sixth time since 1950 that the S&P 500 has made it at least a year without so much as a 5% correction, and marks the longest streak since 1995. The reality is that earnings are strong, inflation is low, the Fed is accommodative, and valuations aren’t excessive when you factor in the historically low rates ―which all suggest the bull market has legs. But all of that doesn’t mean gravity won’t eventually take over. A well-deserved 5% correction could take place at any time, if for no other reason than it has been a year since the last 5% correction.”
As the graph below shows, the current streak started right after the Brexit vote ―the S&P 500 gained 19.1% during this period of tranquility. The longest streak, however, was nearly 20 months (December 1994 to July 1996) when the index ran up more than 40%!
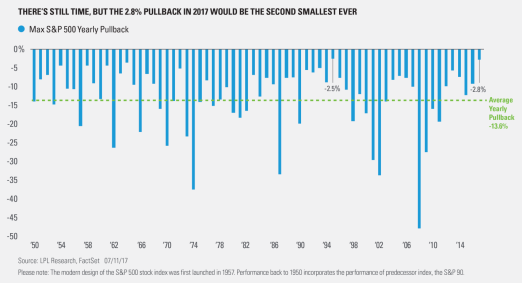
Last, as we noted in 2017 So Far, besides being a historically calm bull market, the maximum drawdown in the S&P 500 year to date has only been 2.8%. Should the year end right now, this would be the second smallest pullback during a year ever―with 1995 experiencing the smallest intra-year correction at 2.5%.
Of course, there is still plenty of time left in 2017, and the odds do favor a potentially larger pullback sometime later this year. Per Ryan Detrick, “To put things in perspective, going back to 1950, the average intra-year correction for the S&P 500 has been 13.6%, and 91% of all years have had at least a 5% correction, while nearly 54% of all years pulled back at least 10%. In other words, history suggests we’ll likely see that 5% correction before the year is over.”
The good news though, as we discussed in our Midyear Outlook 2017, is that any equity weakness should be used as a buying opportunity, as the odds of a major bear market or recession starting soon are extremely low.
IMPORTANT DISCLOSURES
Past performance is no guarantee of future results. All indexes are unmanaged and cannot be invested into directly.
The opinions voiced in this material are for general information only and are not intended to provide or be construed as providing specific investment advice or recommendations for any individual security.
The economic forecasts set forth in the presentation may not develop as predicted.
Investing in stock includes numerous specific risks including: the fluctuation of dividend, loss of principal and potential illiquidity of the investment in a falling market.
Stock investing involves risk including loss of principal.
The Standard & Poor’s 500 Index is a capitalization-weighted index of 500 stocks designed to measure performance of the broad domestic economy through changes in the aggregate market value of 500 stocks representing all major industries.
This research material has been prepared by LPL Financial LLC.
To the extent you are receiving investment advice from a separately registered independent investment advisor, please note that LPL Financial LLC is not an affiliate of and makes no representation with respect to such entity.
Not FDIC/NCUA Insured | Not Bank/Credit Union Guaranteed | May Lose Value | Not Guaranteed by any Government Agency | Not a Bank/Credit Union Deposit
Securities and Advisory services offered through LPL Financial LLC, a Registered Investment Advisor Member FINRA/SIPC
Tracking # 1-624879 (Exp. 6/18)
Copyright © LPL Research


