by LPL Research
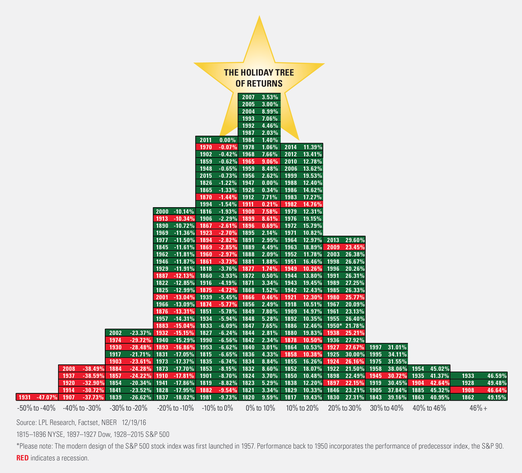
With Christmas less than a week away, we decided to look at historical equity market returns, but in the shape of a Christmas tree.
As you can see below, the majority of the returns have been between 0% and 10%, with the more extreme gains and losses taking place less often as the percentages get larger. We added which years included a recession in red, according to the National Bureau of Economic Research (NBER) going back to 1854. Per Ryan Detrick, Senior Market Strategist, “Yes, more recessionary years saw negative returns more often than not, but surprisingly there have been some strong equity returns during years that had an official recession take place. Obviously most of these big gains took place as the recession was ending; still, this is eye-opening and reinforces not focusing too much on just fundamentals, but also incorporating valuations and technicals. ”
click to enlarge
*****
IMPORTANT DISCLOSURES
Past performance is no guarantee of future results. All indexes are unmanaged and cannot be invested into directly.
The opinions voiced in this material are for general information only and are not intended to provide or be construed as providing specific investment advice or recommendations for any individual security.
The economic forecasts set forth in the presentation may not develop as predicted.
Investing in stock includes numerous specific risks including: the fluctuation of dividend, loss of principal and potential illiquidity of the investment in a falling market.
The New York Stock Exchange is based in New York City, and is considered the largest equities-based exchange in the world based on total market capitalization of its listed securities.
The S&P 500 Index is a capitalization-weighted index of 500 stocks designed to measure performance of the broad domestic economy through changes in the aggregate market value of 500 stocks representing all major industries.
The Dow Jones Industrial Average (DJIA) Index is comprised of U.S.-listed stocks of companies that produce other (nontransportation and nonutility) goods and services. The Dow Jones Industrial Averages are maintained by editors of The Wall Street Journal. While the stock selection process is somewhat subjective, a stock typically is added only if the company has an excellent reputation, demonstrates sustained growth, is of interest to a large number of investors, and accurately represents the market sectors covered by the average. The Dow Jones averages are unique in that they are price weighted; therefore, their component weightings are affected only by changes in the stocks’ prices.
This research material has been prepared by LPL Financial LLC.
To the extent you are receiving investment advice from a separately registered independent investment advisor, please note that LPL Financial LLC is not an affiliate of and makes no representation with respect to such entity.
Not FDIC/NCUA Insured | Not Bank/Credit Union Guaranteed | May Lose Value | Not Guaranteed by any Government Agency | Not a Bank/Credit Union Deposit
Securities and Advisory services offered through LPL Financial LLC, a Registered Investment Advisor Member FINRA/SIPC
Tracking # 1-565441 (Exp. 12/17)
Copyright © LPL Research


