by Jennifer Thomson, Gavekal Capital
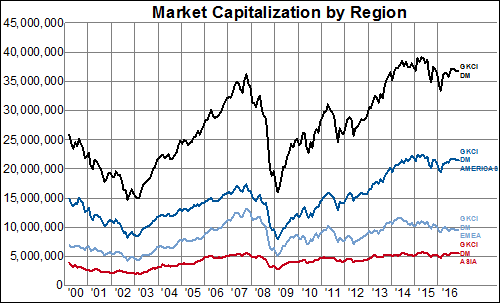
The aggregate market cap of our entire developed world index, GKCI DM (black line), has remained mostly in the range of $35-40T over the last few years, after surpassing the $35T level (previously reached in 2007) in late 2013. DM Americas stocks (dark blue line) make up the majority of the aggregate market cap, contributing ~$22T to the total, while DM EMEA (light blue line) accounts for around $10T (~26% of the total) and DM Asia (red line) has remained steady around $5T (representing ~15% of the total).
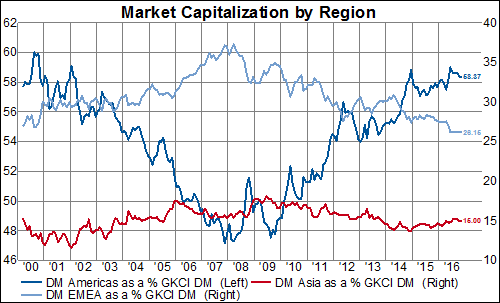
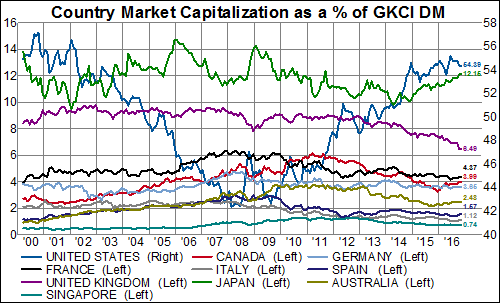
There is a clear difference in trend, however, as DM Americas market cap, in absolute numbers, has nearly tripled since 2009 lows and remains well above 2007 highs. DM Americas share of the total market cap has subsequently risen to near 60%–a high not seen since 2000.
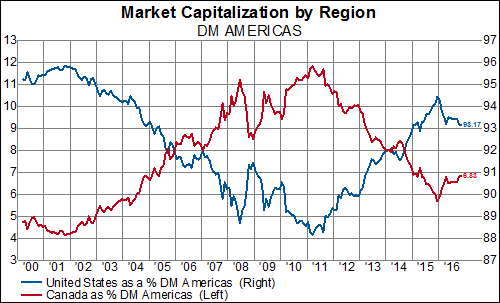
As we might expect, DM Americas is dominated by U.S. shares which make up the bulk of the group (~90%).
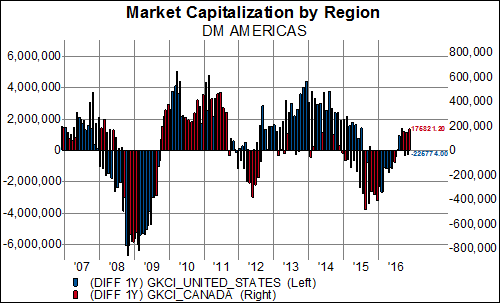
Not only do the U.S. shares account for an overwhelming majority of the DM Americas group, but a look at the one year difference in market cap shows that U.S. shares (in spite of a rough start to 2016) have made consistent gains in nearly every month going back to October 2009 while Canadian shares suffered pronounced losses in 2012 and again in 2015.
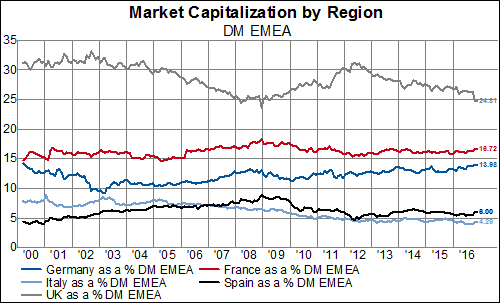
Turning to DM EMEA, where the aggregate market cap has managed to double from financial crisis lows (but still remains well below 2007 highs), we find fairly steady representation of major countries’ market cap as a percent of the total. Notably, U.K. shares (grey line) have fallen to ~25% of the total from a 2002 high of 33%. Meanwhile, Germany’s (dark blue line) market cap has expanded to account for nearly 14% of the DM EMEA total– up from less than 10% in 2003. Italian shares (light blue line) now account for just over 4% of the total, down from near 9% in 2001.
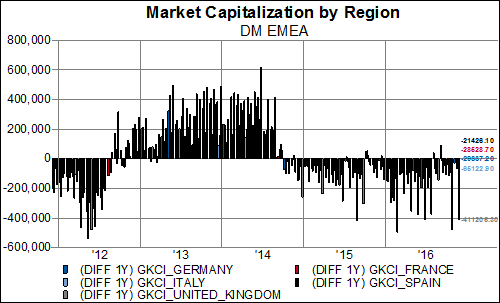
Zooming in to just the last five years, we see more clearly where this region’s relative weakness in market cap growth comes from: with few minor exceptions, companies from the five largest European economies have seen their market value decline on a year over year basis in every month since October 2014. The largest losses have been concentrated in U.K. shares while German shares posted gains (albeit minor) in August and September of this year.
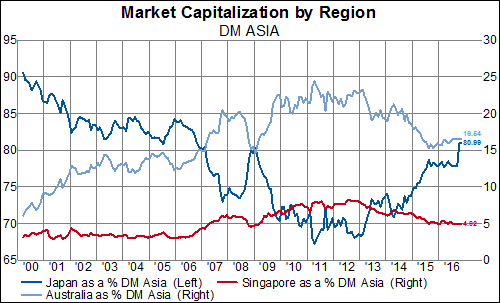
In DM Asia, Japan accounts for more than 80% of the total market cap. That proportion has grown from a low of ~70% in 2010-2013, but is just reaching the range (80-90%) that prevailed up until 2006. Australian shares reached nearly 25% of the total market cap in 2011 (up from just 6% a decade earlier), but have since stabilized in the 15% range.
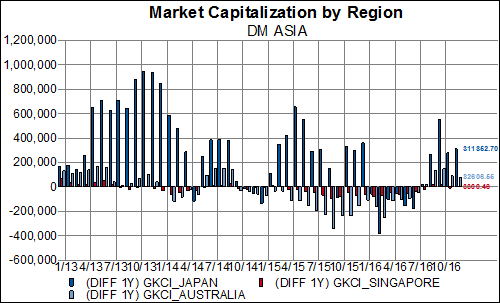
Over the last four years, the market cap of Japanese companies has only declined on a year-over-year basis in twelve of the 48 months, helping to explain the growing dominance of Japanese shares as a percent of the total DM Asia market cap.
After a range-bound three years, what will drive the next leg up in DM market cap? Or will we see a pullback after this consolidation/top? Can the strength in U.S. shares continue to dominate in the DM Americas and globally (or are they set for a period of correction)? What could possibly revive European equities’ market cap? How long can Japan maintain (or expand?) its highest share of DM Asia equities in a decade? Just a few of the many questions we must ask ourselves when contemplating the geographic distribution of our investment choices.
Copyright © Gavekal Capital


