

by Jeffrey Saut, Chief Investment Strategist, Raymond James
One of the funnier shows in the Seinfeld comedy series was “Serenity Now.” The show centered on that phrase (serenity now) as George’s father, Frank Costanza, repeats the phase numerous times every time he gets upset (see it here: serenity). This morning, however, we are using the phrase in reference to Leon Tuey, who states in a recent Edmonton Journal article (link) when referring to his “winter getaway” in Rancho Mirage: “I do absolutely nothing here. I watch the stock market all day long, just as I do at home in Vancouver.” “I get absolute peace and quiet here. A lot of people say, ‘Aren’t you lonely?’ And I say this is exactly what I seek: solitude, so I can think better.” Indeed, “serenity now.”
In said article, Tuey, a former guru at Canadian-based BMO Nesbitt Burns, said he believes this secular bull market has years left to run. While other pundits garner more headlines, Tuey has a habit of being right much more often than he is wrong. Now in his 80s, he is more content with making money for his clients than grabbing headlines. Extremely interesting to Andrew and I were his comments about this secular bull market. To wit: “As Tuey sees it, the first leg of the bull market began in October 2008 and ended in May of 2015, when stocks hit what were then new highs. The second leg began in February of this year, and he expects it to be the longest and strongest leg of all.”
Coincidentally, it was on October 10, 2008 we noted that 92.6% of all stock traded on the New York Stock Exchange made new annual lows. In our notes dating back into the 1960s that has never happened. It’s like an eight standard deviation event; it is not supposed to happen in your lifetime. At the time, we also stated the bottoming process had begun. It was in October 2008 the vast majority of stock bottomed. However, the financial stocks kept going down into March 2009, which is what carried the S&P 500 lower into its intraday low of ~666 on March 6, but we digress.
Students of stock market history will recall secular bull markets tend to have three legs. If Mr. Tuey is correct, we are barely into the second leg of this bull market, which as previously stated, he thinks is going to be, “The longest and strongest leg of all.” Of course that “foots” with our thinking that there is at least another seven to eight years left in this secular bull market. In fact, Tom Lee, sagacious captain of FundStrat, recently published a chart showing the potential for this “bull” to extend into the 2029-2034 timeframe. That seems a touch long to us, but heck, if that’s what the markets give us, we will certainly take it! I did find Tuey’s closing comments, in Gary Lamphier’s article, intriguing: “The second key point is that for the past 100 years or more, the more severe the economic downturn, the more powerful and enduring is the subsequent bull market. When you’re faced with financial Armageddon as the U.S. was back in 2008, the Fed eases much more aggressively than ever before, and they stay accommodative for much longer than normal.”
To be sure, all of this fits with our thesis the equity markets are transitioning from an interest rate-driven to an earnings-driven secular bull market. To that point, many of y’all know we are on an email “string” with folks like Arthur Cashin, David Kotok, Dennis Gartman, Bob Pisani, etc. It is a freewheeling exchange of thoughts that provides very interesting insights. Last Thursday, the savvy Bob Pisani wrote this:
President-elect Trump's proposed nominee for U.S. Treasury Secretary, Steven Mnuchin, said on our air yesterday that the administration was still targeting a reduction in the corporate tax rate from 35% to 15%. The current 2017 estimate for the entire S&P 500 is roughly $131 per share. Thompson estimates that every 1 percentage point reduction in the corporate tax rate could "hypothetically" add $1.31 to 2017 earnings. So do the math: if there is a full 20 percentage point reduction in the tax rate (from 35% to 15%), that's $1.31 x 20 = $26.20. That implies an increase in earnings of close to 20%, or $157. What does that mean for stock prices? The S&P is currently trading at a multiple (PE ratio) of 17, high by historical standards. Applying that 17 multiple to earnings of $157, we get a price on the S&P 500 of roughly 2,669 for 2017. That is 469 points or roughly 20% above where it is today.
Our sense is the new administration will not be able to get the corporate tax rate down to 15%, but even at a 25% rate, it implies an additional $13.10 to the S&P 500’s bottom up operating earnings number ($1.31 x 10 = $13.10). Using Bob’s same math produces an earnings estimate of $144.10, and at 17 times earnings, it renders a price objective of roughly 2450 for the S&P 500.
The equity markets have rallied hard on the belief in a pro-growth administration, reduced regulation, lower taxes, increased infrastructure spending, a reset on trade toward the benefit of American companies, and the reflation trade. If this optimistic scenario comes to fruition, the Penn-Wharton Budget Model targets between a 1.1% and 1.7% increase in GDP growth beginning in 2018. If true, GDP growth could ramp to ~3%+, suggesting stocks are not all that expensive. Verily, we have never wavered on the belief that we remain in a secular bull market. Such bull markets typically last for 14-15 years and tend to compound at around 16% per year. If past is prelude, we should have another seven-plus years in this “bull run.” Will there be pullbacks? Of course there will be, but pullbacks should be viewed within the construct of a secular bull market.
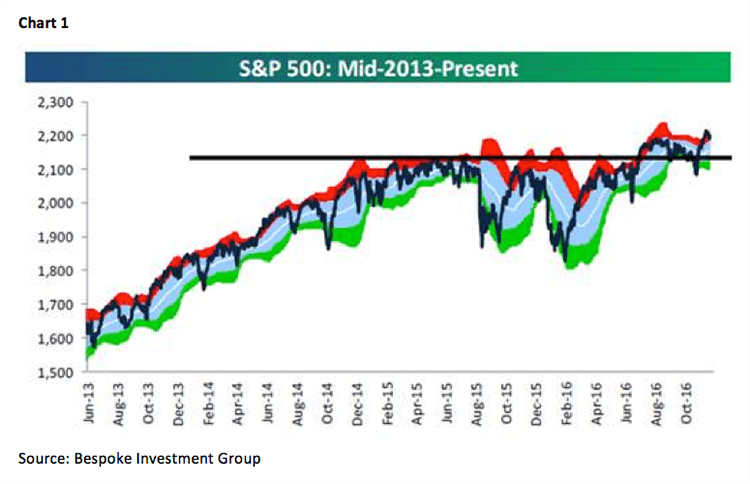
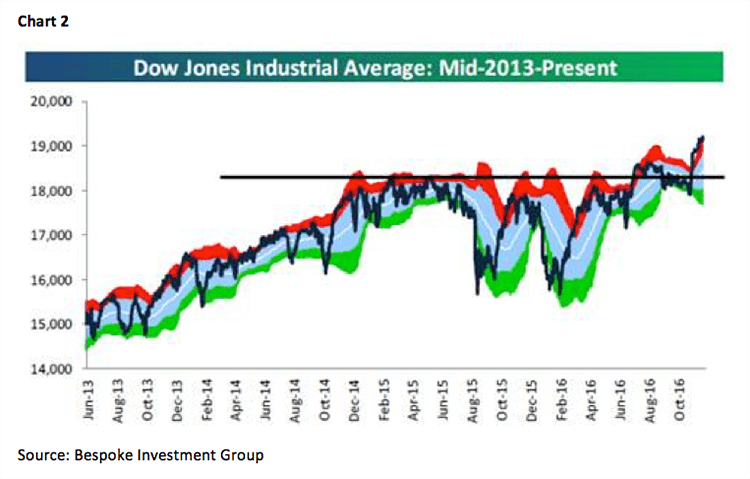
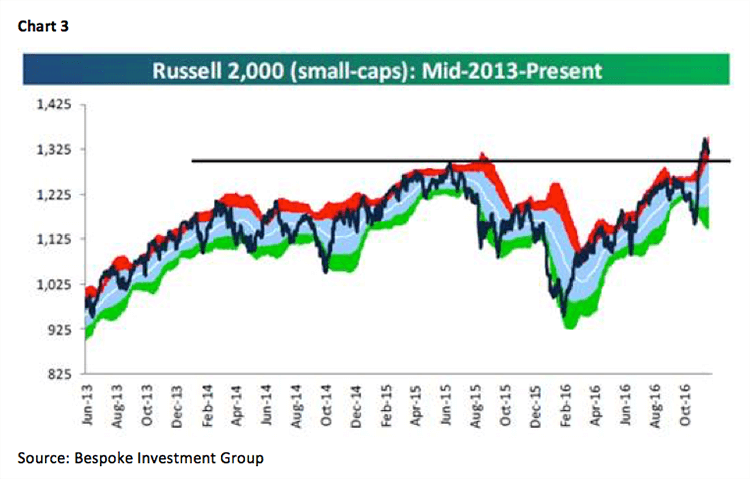
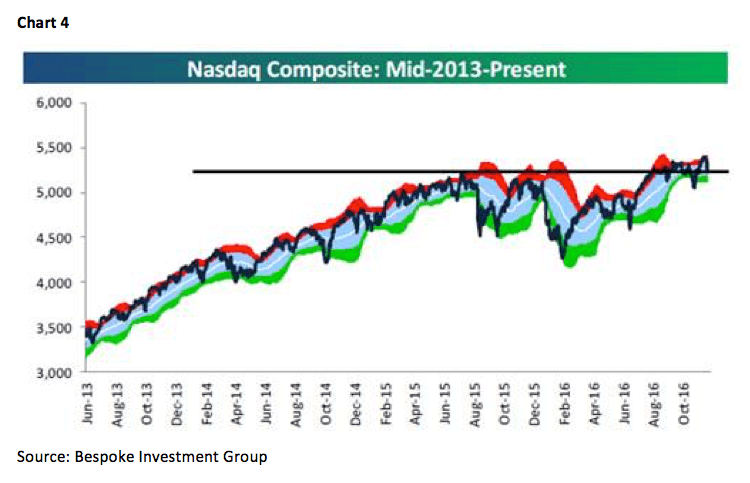
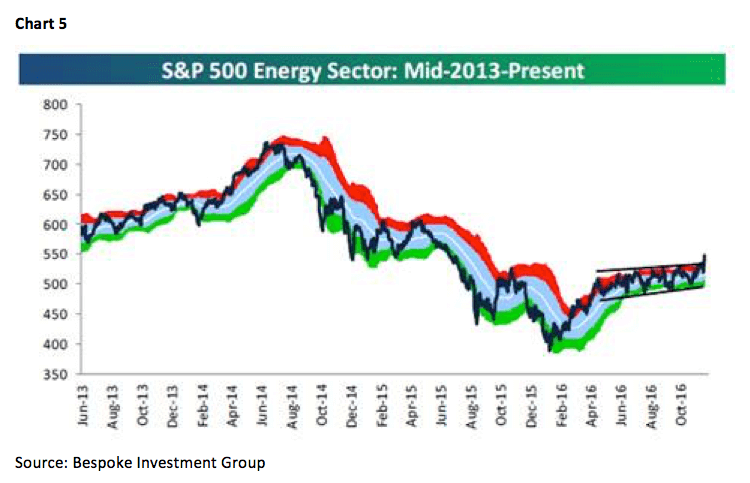
The call for this week: Recently, the S&P 500 experienced a “buying climax.” A “buying climax” is the near-term exhaustion of demand for stocks. The final surge of a “buying climax” tends to lead to an upward price spike followed by waning demand allowing prices to pause and/or pullback. We think that is precisely what happened last week. The pause has permitted the stock market’s internal energy to rebuild, suggesting the S&P 500 (SPX/2191.95) is getting close to grinding higher into our envisioned February short-term “timing point.” Indeed, the picture is clearly bullish when you look at chart patterns of the various indices. The SPX has broken out to the upside after a nearly two-year consolidation (Chart 1). Ditto on the D-J Industrials (Chart 2), and the Russell 2000 has been on a tear (Chart 3). Even the NASDAQ has broken out and, given its recent softness, has merely pulled back to its breakout point (Chart 4). And don’t look now, but the energy sector has broken out to the upside (Chart 5). Meanwhile, the economic news is getting better, and it’s not just here (link; auto-playing video). That makes S&P’s earnings estimate for 2017 of ~$131 doable; and if Bob Pisani’s comments are anywhere near the mark, stocks are not all that expensive. Manifestly, following the “profits trough” in 2Q16, earnings rebounded in 3Q16, a trend we expect to continue for the foreseeable future. Obviously, international investors, as well as U.S. investors, are beginning to sense this too. A little over a month ago, we wrote about the recommendation in a government-commissioned report for Norway’s Global Government Pension Fund (~$880 billion) to increase its exposure to equities from 60% to 70%. While they have not done that yet, it is a view many endowment and pension funds are slowly embracing. Quite frankly, it is the only way they can achieve their targeted returns. Over the weekend, another such gleaning occurred when the Finnish Pension Fund (~$38 billion) made the decision to no longer underweight U.S. equities. As for Italy’s “no” vote, as we told accounts in NYC last week, it is hard to believe it is not already “baked” into the various markets. That seems to be the case this morning with the S&P futures up some nine points.
Copyright © Raymond James