by LPL Research
53 years ago today, on one of the darkest days in our country’s history, President John F. Kennedy was assassinated. A disruptive event that scarred the nation, over the coming weeks and months people still went to work and corporate America continued to function even as the nation mourned. Our economy and stock can be incredibly resilient, in this case the S&P 500 gaining more than 24% the next 15 months.
Markets continue to be driven, above all else, by corporate fundamentals and just yesterday the S&P 500, Dow, Nasdaq, and Russell 2000 all closed at new highs for the first time since December 31, 1999. Some will hear that date and immediately think this is a bearish signal, as that date was very close to the end of an 18-year bull market. Here’s the catch: We saw all four major indexes also make a new high a total of 47 times during the 1990s. In fact, the first time it happened was on December 31, 1991, when the S&P 500 closed at 417.28. In other words, it went on to gain approximately 252% from the first signal in 1991 to that fateful signal in late 1999.
According to Ryan Detrick, Senior Market Strategist, “We might hear a lot how the last time we saw various indexes all making a new high was December 31, 1999, and that was a very ominous time to be long equities. That is true, but what you might not hear is how this signal also happened dozens of times during the 1990s, and none of those times suggested anything other than a broad-based market rally.”
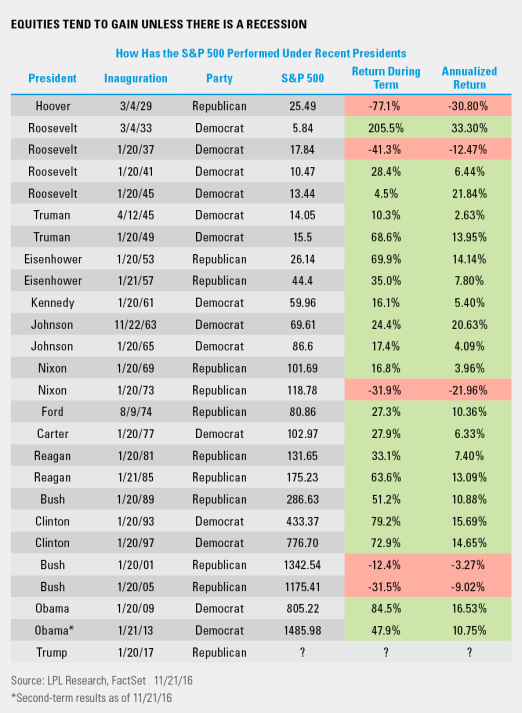
With the election and past returns still a very popular question, in honor of JFK, today we decided to break down the S&P 500 returns by president. We’ve already looked at it by four year cycle recently, but this is a slight twist and goes by each president’s actual term in office. The bottom line is the majority of the time you’ll see equity gains while a president is in office, unless the economy has a recession. The Great Depression, the recession in the early 1970s, and both recent recessions all pushed equity prices lower while the various presidents were in office. We’ve said this before and we’ll say it again: the current economy is the strongest any new president has walked into since Bill Clinton in the early 1990s. This could bode well for continued gains into at least next year.
Please note: The modern design of the S&P 500 stock index was first launched in 1957. Prior performance incorporates data of the predecessor index, the S&P 90.
*****
IMPORTANT DISCLOSURES
Past performance is no guarantee of future results. All indexes are unmanaged and cannot be invested into directly. Unmanaged index returns do not reflect fees, expenses, or sales charges. Index performance is not indicative of the performance of any investment.
The economic forecasts set forth in the presentation may not develop as predicted.
The opinions voiced in this material are for general information only and are not intended to provide or be construed as providing specific investment advice or recommendations for any individual security.
Stock investing involves risk including loss of principal.
Because of its narrow focus, specialty sector investing will be subject to greater volatility than investing more broadly across many sectors and companies.
The NASDAQ-100 Index includes 100 of the largest domestic and international non-financial securities listed on The Nasdaq Stock Market based on market capitalization. The Index reflects companies across major industry groups including computer hardware and software, telecommunications, retail/wholesale trade and biotechnology.
The Russell 2000 Index measures the performance of the small cap segment of the U.S. equity universe. The Russell 2000 Index is a subset of the Russell 3000 Index representing approximately 10% of the total market capitalization of that index.
The S&P 500 Index is a capitalization-weighted index of 500 stocks designed to measure performance of the broad domestic economy through changes in the aggregate market value of 500 stocks representing all major industries.
This research material has been prepared by LPL Financial LLC.
To the extent you are receiving investment advice from a separately registered independent investment advisor, please note that LPL Financial LLC is not an affiliate of and makes no representation with respect to such entity.
Not FDIC/NCUA Insured | Not Bank/Credit Union Guaranteed | May Lose Value | Not Guaranteed by any Government Agency | Not a Bank/Credit Union Deposit
Securities and Advisory services offered through LPL Financial LLC, a Registered Investment Advisor
Member FINRA/SIPC
Tracking # 1-557933 (Exp. 11/17)
Copyright © LPL Research


