by LPL Research
Small caps have been on fire, as the Russell 2000 has been up 10 consecutive days for the first time since March 2013. As we noted in our Weekly Market Commentary: “What A Week,” small caps could be one of the groups to benefit from a Trump presidency, due to easier credit standards and their greater domestic focus. This huge run brings with it many questions—most specifically, can this rally continue?
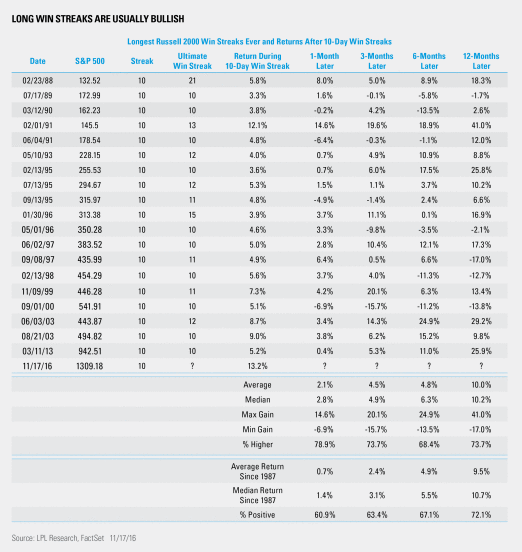
Going back in history, the Russell 2000 has been higher 10 consecutive days 19 other times and the median return a month later has been 2.8%, twice the average median monthly return of 1.4%. Then going out three months, again the returns were stronger than usual. Once you get out to six months, returns normalize. In other words, the near-term returns after long win streaks on small caps tend to see an extension of the near-term strength. According to Ryan Detrick, Senior Market Strategist, “The recent strength in small caps is a nice sign for the overall market, as small cap strength tends to reflect more of an appetite for risk. Not to mention, when the Russell 2000 is up 10 days in a row, this actually leads to stronger returns going out.”
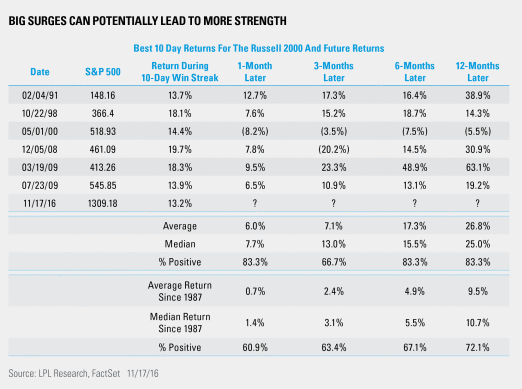
Another way to look at this is the Russell 2000 is up more than 13% the past 10 days, the best 10-day rally since July 2009. You’d think big moves like this could suggest a near-term pullback, but surprisingly that may not be the case, as the Russell 2000 has been up another 6.0% on average a month later after big 10-day surges. Below we looked at the largest 10-day rallies, looking at only the initial rally when several 10-day rallies were clustered together, as often happens.
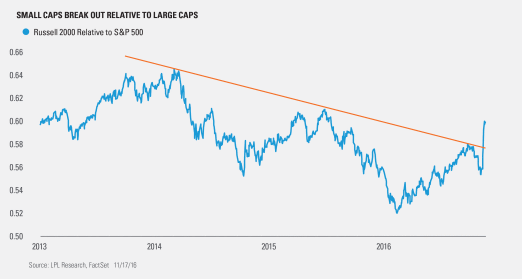
Last, if you simply looked at the Russell 2000 relative to the S&P 500, small caps have delivered above-average returns going back nearly three years. This could be another clue that small caps are finally improving after lagging their large cap peers for years.
IMPORTANT DISCLOSURES
Past performance is no guarantee of future results. All indexes are unmanaged and cannot be invested into directly. Unmanaged index returns do not reflect fees, expenses, or sales charges. Index performance is not indicative of the performance of any investment.
The economic forecasts set forth in the presentation may not develop as predicted.
The opinions voiced in this material are for general information only and are not intended to provide or be construed as providing specific investment advice or recommendations for any individual security.
Stock investing involves risk including loss of principal.
Because of their narrow focus, specialty sector investing, such as healthcare, financials, or energy, will be subject to greater volatility than investing more broadly across many sectors and companies.
The S&P 500 Index is a capitalization-weighted index of 500 stocks designed to measure performance of the broad domestic economy through changes in the aggregate market value of 500 stocks representing all major industries.
The Russell 2000 Index measures the performance of the small cap segment of the U.S. equity universe. The Russell 2000 Index is a subset of the Russell 3000 Index representing approximately 10% of the total market capitalization of that index.
This research material has been prepared by LPL Financial LLC.
To the extent you are receiving investment advice from a separately registered independent investment advisor, please note that LPL Financial LLC is not an affiliate of and makes no representation with respect to such entity.
Not FDIC/NCUA Insured | Not Bank/Credit Union Guaranteed | May Lose Value | Not Guaranteed by any Government Agency | Not a Bank/Credit Union Deposit
Securities and Advisory services offered through LPL Financial LLC, a Registered Investment Advisor
Member FINRA/SIPC
Tracking #1-556994 (Exp. 011/17)
Copyright © LPL Research


