For this week’s SIA Equity Leaders Weekly, we are going to re-examine the Gold Continuous Contract (GC.F) as well as to Gold Equity Sector by using the Van Eck Gold Miners ETF (GDX). A lot has changed since we last commented on Gold and the Gold sector back in early October. A new political landscape has emerged since then which has had a significant impact on Gold and with a potential for more changes going forward could impact gold prices even further.
Gold Continuous Contract (GC.F)
A new political regime has emerged with the Trump Administration set to take office later in January. With the new regime’s plans to boost domestic spending, cut taxes as well as Trump’s trade and immigration policies may suggest the labor market will get even tighter. All these factors combined has the potential to stoke inflation expectations in the future. Since the election results we have also seen Treasury bond yields moving higher and a resurgence in the US dollar. With the recent strength in the US dollar comes the increased likelihood the US will increase the Fed interest rate more quickly. A stronger US dollar and higher interest rate may be negative for non-yielding gold bullion. The latest data from Bloomberg has revealed that economists now think there is a 92 per cent chance of an interest rate hike when the Fed meets in early December
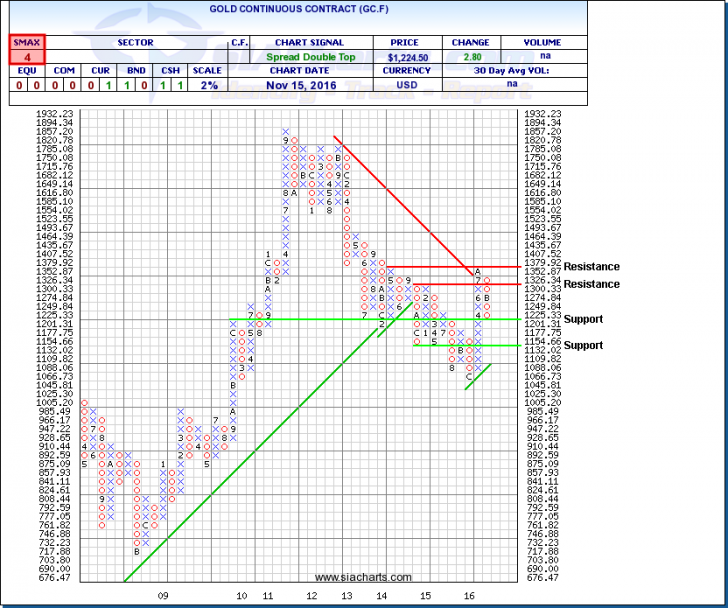
Thus, let’s look at the recent movement of the Gold Continuous Contract. The last time we spoke of the Gold Continuous Contract was on the Oct 6th edition of the Equity Leaders Weekly. In looking at the attached chart, we see that gold has continued to trend downwards since it reached a peak earlier this summer at approximately $1352.00. Tuesday’s closing price for bullion was $1224.50 which equates to a 9.5% decrease in price. It has broken through its previous initial support at the 3-box reversal point which was at $1249.84. Support is now found at $1201.31. The next level of support below that, is $1132.02. To the upside, resistance is now found at $1326.34 and, above that, $1379.92. The SMAX score, SIA’s proprietary near term relative strength indicator has now turned negative with a score of 4 out 10. In our previous commentary, the SMAX score was an 8 out of 10. It will be interesting to see going forward how gold reacts if the US Fed does proceed to increase interest rates at its upcoming December meeting.
Click on Image to Enlarge

Van Eck Gold Miners ETF (GDX)
Now lets draw our attention to Gold Equities and how they have performed during this same period. During our last commentary, we spoke of how well Gold Equities (by using the Van Eck Gold Miners ETF as a Proxy) had performed visa vis the performance of its underlying commodity. Gold Equities had outperformed Gold Bullion during its rally in the first half of this year. Since many of the Gold Equities had appreciated 2 to 4 times the amount compared to the underlying bullion during that time, we had indicated in our last update that a small decrease in price change of the commodity or a change in trend could have a larger impact on gold stocks due to the volatile nature of this sector.
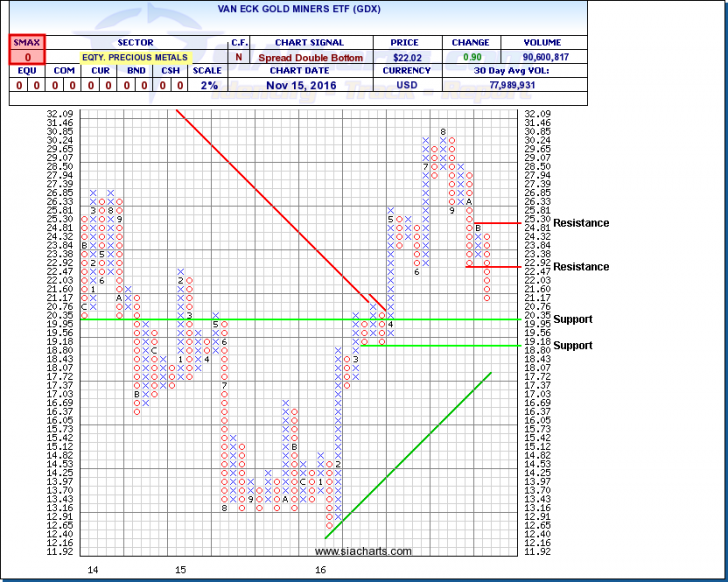
Let’s take a look at the attached chart of the Van Eck Gold Miners ETF (GDX) and see how the gold equity space has performed during this continued pullback in bullion we have seen. The Van Eck Gold Miners ETF peaked at a price of approximately $31 per share in the summer. As of Tuesday’s close the price was at $22.02 which equates to a 29% decrease in price. This magnifies the impact of getting exposure to such a volatile sector such as precious metals. Support for GDX is at $19.95 and below that, $18.80. Resistance is at $22.92 and, above that, $25.30. With an SMAX score of 0 out of 10, GDX is showing no strength whatsoever against other asset classes. As we had indicated to our readers in the past, we can always experience short term rallies in any stock or sector but this doesn’t mean that there is a longer-term change in trend. The SIA Asset Class Rank List (our top down “macro” indicator) had listed the Commodity Asset Class at the bottom half of the list anywhere from the 4th position to the 6th position during this same time frame. We always stress the importance of referring to our Asset Class Rank List first. This is a primary indicator of relative strength on an asset class level and indicates to you whether money is flowing in or out of that asset class. It is critical to align yourselves with these changing money flows. If a longer-term outlook is more important to you then paying attention to our “macro” indicator will help you better identify these longer-term changes in trend and assist you in avoiding getting caught in shorter term rallies.
Click on Image to Enlarge

For a more in-depth analysis on the relative strength of the equity markets, bonds, commodities, currencies, etc. or for more information on SIACharts.com, you can contact our customer support at 1-877-668-1332 or at siateam@siacharts.com.
SIACharts.com specifically represents that it does not give investment advice or advocate the purchase or sale of any security or investment. None of the information contained in this website or document constitutes an offer to sell or the solicitation of an offer to buy any security or other investment or an offer to provide investment services of any kind. Neither SIACharts.com (FundCharts Inc.) nor its third party content providers shall be liable for any errors, inaccuracies or delays in content, or for any actions taken in reliance thereon.
Copyright © SIACharts.com


