For this week’s edition of the Equity Leaders Weekly, we are going to re-examine the energy equity markets and a key commodity linked to the energy equity markets being Natural Gas.
Natural Gas Continuous Contract (NG.F)
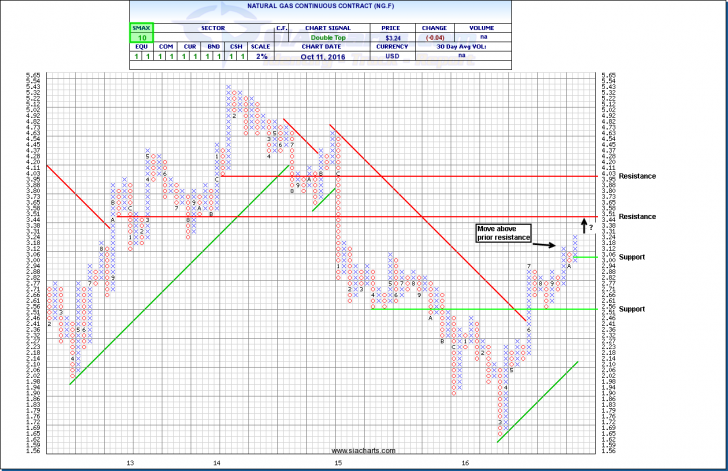
Let’s first examine the Natural Gas Continuous Contract (NG.F). We last looked at natural gas on the Sept 1st edition of the Equity Leaders Weekly. At that time, we had seen a rebound in natural gas prices which may have finally found a bottom at $1.65 back in March of this year. Let’s take a look and see what the price of Natural Gas has done in just less than a few months since our last natural gas update.
In looking at the chart of the Natural Gas Continuous Contract (NG.F) we can see that the price of natural gas has continued to strengthen. It has recently broken above some prior key resistance points, the last one being at the $3.12 level. The next level of resistance can now be found at $3.51 and, above that, $4.03. Support can be found at $3.00 and, below that, $2.51. With an SMAX of 10 out of 10, NG.F is showing near term strength against all asset classes.
In looking at the latest storage figures from the US Energy Information Administration (EIA), natural gas storage figures are still above the top range of the 5-year historical average at 3680 Bcf. However, in looking at the weekly injection numbers, the last weekly injection number was an injection of 80 Bcf which is less than the 5-year average weekly net injection of 95 Bcf during the same week. The natural gas refill season typically begins on April 1st. This year is shaping up to be the only refill season (except for 2012) to not post a single week that exceeds a 100 Bcf net weekly injection. According to the EIA, normally we exceed this 100 Bcf threshold at least twice per year. On April 1, natural gas storage was 874 Bcf above the 5-year average but now working gas storage is 205 Bcf above the 5-year average. The markets may be taking into account this trend of somewhat slightly lower working gas storage as we enter the winter months which typically sees natural gas demand spike due to the colder weather. It will be interesting to see if these lower weekly injection numbers over the past refill season and a colder than normal winter will have a further impact of the natural gas prices going forward.
Click on Image to Enlarge
SIA Energy Equal Weight Index (EWI345)
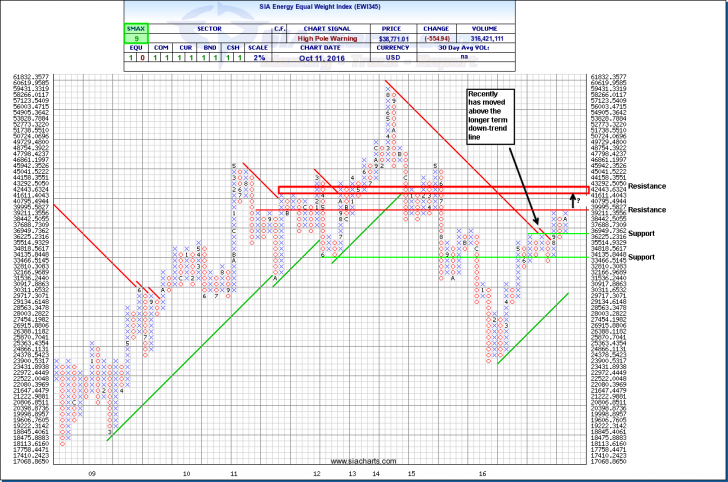
Let’s now take a look at the equities linked to the energy markets given the move in the underlying natural gas (and oil) price. We are going to use the SIA Energy Equal Weight Index (EWI345) as a proxy for how the Energy names have performed. The SIA Energy Equal Weight Index is comprised of the 50 most liquid energy names in Canada and the US.
As you can see in the attached chart, the EWI345 began reversing its trend in March of this year which happened to co-incide with the perceived bottom in natural gas. The longer term downtrend line has recently been broken and we are quickly approaching a key near term resistance point at ~ 40,000 level. If it happens to break above this near-term resistance, the next level of resistance 42,433 to 43,292 range. Support can be found at ~37,000 and, below that, the ~ 33,500 level. It will be interesting to see if the equity names will trend higher in line with the underlying commodities or if the equities will experience some sort of profit taking in light to the large bounce from the bottom this past March. With an SMAX score of 9 out of 10, the EWI345 is showing near term strength against all asset classes.
In light of this recent price action in the EWI345, it is always important to consider the Asset Class Rank List when making your investment decisions. Staying away from Asset Classes at or near the bottom of the Asset Class Rank List and focusing on getting exposure to Asset Classes near or at the top of the Asset Class Rank List significantly reduces your risk profile by ensuring you are always in the lower risk asset at any given point in time. Energy names can move in tandem with the underlying commodities. With the Commodity Asset Class currently in the #5 spot of the SIA Asset Class Rank List, caution must be exhibited when entering this space not only due to the volatile nature of the energy and commodity markets but also the increased risk you can be taking on in getting exposure to asset classes lower in the Asset class Rank List.
Click on Image to Enlarge
SIACharts.com specifically represents that it does not give investment advice or advocate the purchase or sale of any security or investment. None of the information contained in this website or document constitutes an offer to sell or the solicitation of an offer to buy any security or other investment or an offer to provide investment services of any kind. Neither SIACharts.com (FundCharts Inc.) nor its third party content providers shall be liable for any errors, inaccuracies or delays in content, or for any actions taken in reliance thereon.
For a more in-depth analysis on the relative strength of the equity markets, bonds, commodities, currencies, etc. or for more information on SIACharts.com, you can contact our customer support at 1-877-668-1332 or at siateam@siacharts.com.
Copyright © SIACharts.com


