For this week’s edition of the Equity Leaders Weekly, we are going to re-examine two Brazil based ETFs which we last spoke of back on the May 5th - the iShares MSCI Brazil Capped ETF (EWZ) and the Wisdom Tree Brazilian Real Strategy Fund ETF (BZF). As some of you may have noticed, the top ETF in SIA’s All CAD ETF Report is the Brazil based ETF, iShares MSCI Brazil ETF (XBZ.TO) which is a very similar, Canadian traded ETF to EWZ which we spoke about in May. There have been some other emerging market ETFs that have recently entered the favored zone in the SIA ALL CAD ETF report such as the iShares BRIC ETF (***) and the iShares Emerging Market Fundamentals ETF (***) which may give indication of the general strength in the Brazilian Equity Markets. Brazilian Equities have moved higher starting in early March as the country’s corruption crackdown to oust former President Dilma Rousef began. The new President, Michel Temer, has brought new found stability in the political regime in Brazil leading their markets on a positive trend. In addition to this new found political stability, there are recent reports that the Brazilian economy may have found a bottom after suffering its worst recession in decades. Some leading economic indicators have indicated that the economy has stopped deteriorating and is raising the prospects for a return to some economic growth. According to a survey of 100 economists by the nation’s central bank, the Brazilian economy contracted 3.8% in 2015 with a projected contraction of 3.3% expected in 2016. However, this same survey projects GDP for 2017 to grow by 1% which may indicate why their markets have done well of late.
iShares MSCI Brazil Capped ETF (EWZ)
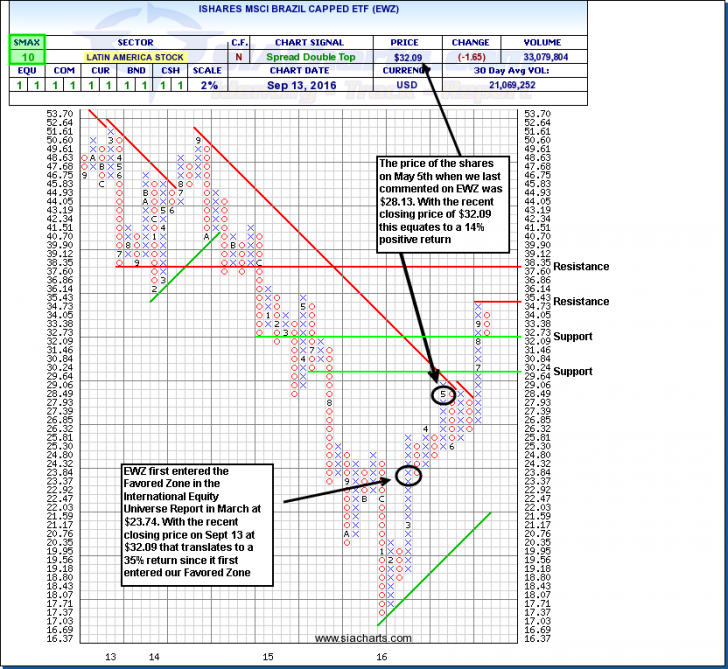
To be consistent, we will examine how the iShares MSCI Brazil Capped ETF (EWZ) has performed since we last looked at it in the ELW. On May 5th, EWZ was on the verge of breaking above it’s long term downtrend line at the $28.00 level. Since then, EWZ has remained very strong and has moved well past this long term downtrend line to a recent high at $34.73 which was achieved earlier this month. It currently is experiencing a mild pullback and sits at $32.09. However, the SMAX score still remains strong at 10, which indicates is it exhibiting near term strength against all asset classes. When we first commented on EWZ on May 5th the price of the ETF was $28.13. As of the Tuesday Sept 13th close, the shares are at $32.09. This is a 14% positive return in a little over 4 months. In fact, the EWZ first entered the favored zone in the International Equity Universe Report in early March when the price of the shares was $23.74. This translates into a 35% return in a little over 6 months from the point EWZ entered the favored zone in its comparable equity universe. This move since we last commented on the shares in May and the point in time when the shares first moved into the favored zone of SIA’s various reports is proof of concept that you should always be looking at holdings that reside in the favored zone and continue to look at them while they are still in the favored zone. In looking at the chart of EWZ, it is right at support at $32.09. Below that, the next level of support is at $29.64. To the upside, resistance can be found near the recent high at $35.43 and, above that, $38.35.
Click on Image to Enlarge

WisdomTree Brazilian Real Strategy Fund (BZF)
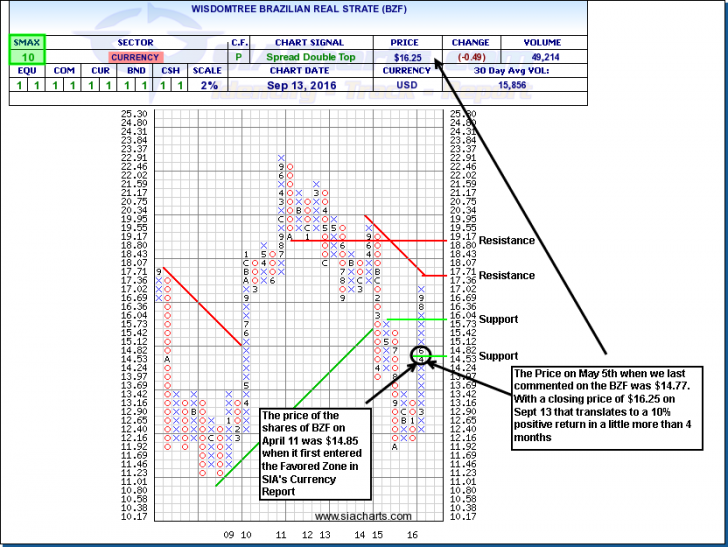
The WisdomTree Brazilian Real Fund (BZF) tracks the money market rates in Brazil Real (BRL) currency relative to the US Dollar. With the pullback in the USD in the first quarter of 2016 and subsequent sideways consolidation pattern on the USD since the pullback, we have seen the Brazilian Real showing strength. Not withstanding, the renewed stability of the political landscape in Brazil is also drawing investments in both the Brazilian Equity Market and the Real. In looking at the attached chart of the (BZF), the ETF has remained very strong. With an SMAX score of 10 out of 10, BZF is showing near term strength against all asset classes.
When we last looked at BZF on May 5th, the shares were at $14.77. As of the Tuesday Sept 13th close, the shares are at $16.25 which translates into a ~10% positive return since May 5th. BZF is currently ranked #1 in SIA’s Currency Report and it entered the favored zone in the report on April 11 at $14.85 which equates to the same ~10% positive return up until today. Support can be found at $15.73 and, below that, $14.53. To the upside, resistance can be found at the long term downtrend line at $17.71 and, above that, $19.17. This is another perfect example to always look at holdings in the favored zone and continue to look at them as long as they still reside in the favored zone. By positioning yourself in this manner, you will align yourself to these changing money flows and you are essentially positioning yourself in a lower risk proposition.
Click on Image to Enlarge

SIACharts.com specifically represents that it does not give investment advice or advocate the purchase or sale of any security or investment. None of the information contained in this website or document constitutes an offer to sell or the solicitation of an offer to buy any security or other investment or an offer to provide investment services of any kind. Neither SIACharts.com (FundCharts Inc.) nor its third party content providers shall be liable for any errors, inaccuracies or delays in content, or for any actions taken in reliance thereon.
For a more in-depth analysis on the relative strength of the equity markets, bonds, commodities, currencies, etc. or for more information on SIACharts.com, you can contact our customer support at 1-877-668-1332 or at siateam@siacharts.com.


