For this week’s Equity Leaders Weekly, we are going to take a look at the broad Canadian Equity Market, through the S&P/TSX Composite Index (TSX.I), which has continued its upwards trend into September from its lows in January. We will also take a look at long-term Canadian Bonds to highlight that the strength hasn't just come in Canadian equities this year as long-term bonds continue to show strength up 11.25% this year.
S&P/TSX Composite (TSX.I)
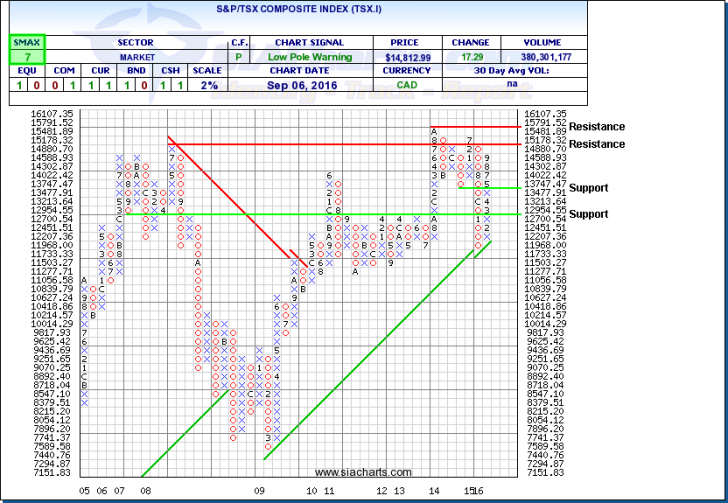
The S&P/TSX Composite Index is currently having its best performance up ~13.7% YTD so far since 2010 when it finished up around 14.5% on the year. From a point and figure charting standpoint, the S&P/TSX Composite Index (TSX.I) is approaching some resistance, that we highlighted in June the last time we wrote about this chart, around $15,000 at $15,178. Above this is the all-time highs to consider at $15,791 that could provide another level of resistance should this strength continue. The Bank of Canada today kept their key interest rate target steady at 0.5% which wasn’t a surprise but raised concerns as Canada’s economy shrank in the second quarter worse then expected. "While Canada's economy shrank in the second quarter, the bank still projects a substantial rebound in the second half of the year," the Bank of Canada said.
The strong sectors in Canada that have been outperforming over the last quarter were led by Financials, Banking, and Industrials as the run in Materials and Precious Metals has slowed. Consumer Staples has also proved a steady and consistent outperformance as well and currently ranks as the highest sector in the SIA CAD Equity Specialty ETF Report. However, concerns over the Vancouver housing market’s “possible moderation”, were signaled out by the Bank of Canada, to watch closely as well. For the TSX to rally through some of these resistance levels and highs it is approaching, it may still need help from a rise in Commodity prices, especially Crude Oil, and strength in the Canadian dollar to have a sustainable breakthrough. With SIACharts, you can keep a close on the relative strength of the Canadian sectors when a rotation of strength happens within the Canadian market to make sure you are always aligned with the best areas of the market to help avoid significant sector drawdowns.
Click on Image to Enlarge


iShares Core Canadian Long-Term Bond (XLB.TO)
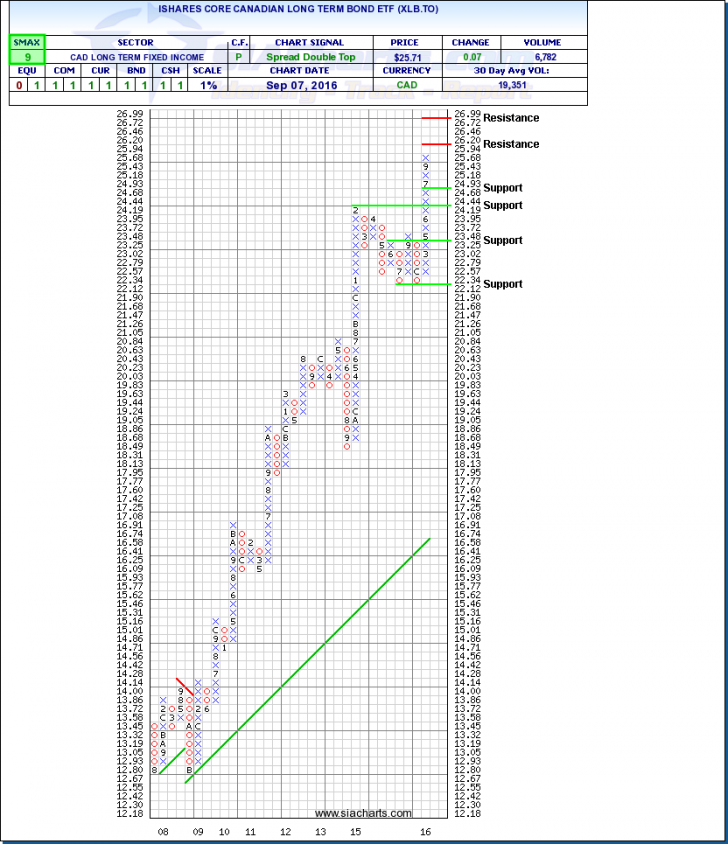
Many advisors have asked us at SIACharts why Bonds continues to be the number one ranked asset class and we believe this chart and some of the long-term bond returns will help explain why. As of the close of Sept. 7th, the iShares Core Canadian Long-Term Bond (XLB.TO) is up ~11.25% YTD and ~12.22% in the last year. It is also up ~11.55% compounded annually over the last 3 years. In comparison, the S&P/TSX Composite Index that we looked at above is only up ~9.78% over the last year and ~4.89% over the last 3 years (though it has seen better near-term returns from its lows in February). The broad Bond indices in the U.S. and Canada aren’t up by the same amount as stated above as long-term bonds, as there are definitely still equity opportunities and sectors to invest in, but long-term bonds continue to show long-term relative strength in Canada for Fixed Income strategies you may be running or considering as long-term fixed income has been ranked at the top of the SIA Bond asset class in the CAD ETF Sector rankings over the last year.
The iShares Core Canadian Long-Term Bond (XLB.TO) has seen a strong move upwards off a prior support level at $22.12 that has seen it create a column of X’s towards the first resistance level found at $26.20 as it has moved to new all-time highs. Resistance above this is now found around $27. Further support is found at the high from Feb of 2015 at $24.19 should XLB.TO see a reversal. The SMAX score is showing near-term strength of a 9 out of 10 against other asset classes. Keeping a close eye on the interest levels and the Government of Canada's policy changes will be important for further understanding on whether this run in long-term bonds will continue or face downward pressure, but with the Bank of Canada’s dovish comments today, most aren’t expecting the central bank to make any sudden moves.
For a more in-depth analysis on the relative strength of the equity markets, bonds, commodities, currencies, etc. or for more information on SIACharts.com, you can contact our customer support at 1-877-668-1332 or at siateam@siacharts.com.
Click on Image to Enlarge
SIACharts.com specifically represents that it does not give investment advice or advocate the purchase or sale of any security or investment. None of the information contained in this website or document constitutes an offer to sell or the solicitation of an offer to buy any security or other investment or an offer to provide investment services of any kind. Neither SIACharts.com (FundCharts Inc.) nor its third party content providers shall be liable for any errors, inaccuracies or delays in content, or for any actions taken in reliance thereon.
Copyright © SIACharts.com


