Party Like its 1999? Or Is Now Another Bubble Peak?
by LPL Research
As we noted yesterday on the blog, last week the S&P 500, Dow, and Nasdaq all made new highs on the same day for the first time since December 31, 1999. That was of course right before a major recession, a three-year equity bear market, and a nearly 50% drop in the Nasdaq over the next 12 months. This brings about the $64,000 question–is this another 1999?
Fortunately, we don’t think the environment now is like 1999. One of the major differences between now and then is that market breadth is much stronger. Back in the late 1990s, technology was the only group leading—making the market’s underpinnings rather weak. Compare that with today, when many stocks and sectors are participating. Seeing tech and healthcare both finally start to lead after lagging much of the past year are two major positives that indicate leadership is on firm footing.
We’ve been noting the strength of market breadth for several months now, which may lead to potentially higher prices. In fact, right before the Brexit vote in the Weekly Market Commentary, “Overcoming a Wall of Worry,” we noted market breadth was very strong and a major positive. Sure enough, Brexit caused a two-day, 5% sell-off, but the dip was quickly bought and new highs are now happening across the board.
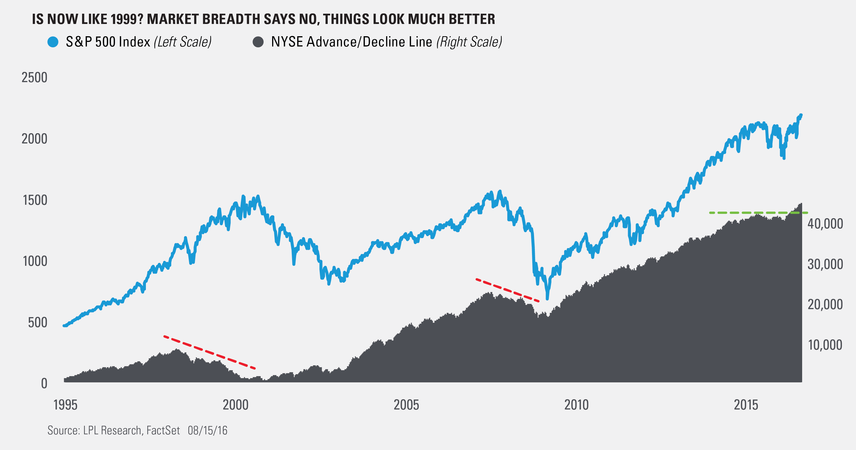
One of our favorite ways to measure market breadth is via advance/decline lines (A/D lines). A/D lines are computed daily by adding the number of securities in an index that are higher and subtracting the number that are lower. An upward-trending A/D line is a sign of broad participation and underlying strength—a good sign. Yesterday, various A/D lines broke out to new highs with the following making new highs: the S&P 500, S&P Midcap, S&P Small Cap, Nasdaq, NYSE, NYSE common stock only, and the Dow just barely missed a new high.
Turning to the New York Stock Exchange (NYSE) A/D line, it broke out to a new high back in early April—well ahead of the July breakout in the S&P 500. But as we noted at that time, breadth tends to lead price, and it did once again this time, as price eventually followed through and made new highs a few months later.
Looking at the NYSE A/D line going back to the previous two bull markets, each time this line broke down ahead of the actual breakdown in price. In fact, in the late 1990s it weakened for multiple years ahead of the eventual tech bubble peak. Compare that with today and new highs happening, breadth isn’t flashing any warning; in fact, it is saying things continue to look very strong.
During the past few months breadth has been saying 2016 could see an upside move and has been correct so far. With no real weakness emerging from various A/D lines, it is safe to say market breadth continues to be one of the most compelling reasons to expect potentially higher stock prices. Remember, this doesn’t mean there can’t and won’t be any pullbacks—we expect there will be. But with breadth this strong, we would expect any pullback to be potentially in the 5–10% range and would view them as potential buying opportunities.
*****
IMPORTANT DISCLOSURES
Past performance is no guarantee of future results. All indexes are unmanaged and cannot be invested into directly. Unmanaged index returns do not reflect fees, expenses, or sales charges. Index performance is not indicative of the performance of any investment.
The economic forecasts set forth in the presentation may not develop as predicted.
The opinions voiced in this material are for general information only and are not intended to provide or be construed as providing specific investment advice or recommendations for any individual security.
Stock investing involves risk including loss of principal.
The S&P 500 Index is a capitalization-weighted index of 500 stocks designed to measure performance of the broad domestic economy through changes in the aggregate market value of 500 stocks representing all major industries.
The Nasdaq Composite Index measures all Nasdaq domestic and non-U.S.-based common stocks listed on the Nasdaq stock market. The index is market-value weighted. This means that each company’s security affects the index in proportion to its market value. The market value, the last sale price multiplied by total shares outstanding, is calculated throughout the trading day, and is related to the total value of the index. It is not possible to invest directly in an index.
The Dow Jones Industrial Average Index is comprised of U.S.-listed stocks of companies that produce other (non-transportation and non-utility) goods and services. The Dow Jones industrial averages are maintained by editors of The Wall Street Journal. While the stock selection process is somewhat subjective, a stock typically is added only if the company has an excellent reputation, demonstrates sustained growth, is of interest to a large number of investors, and accurately represents the market sectors covered by the average. The Dow Jones averages are unique in that they are price weighted; therefore, their component weightings are affected only by changes in the stocks’ prices.
This research material has been prepared by LPL Financial LLC.
To the extent you are receiving investment advice from a separately registered independent investment advisor, please note that LPL Financial LLC is not an affiliate of and makes no representation with respect to such entity.
Not FDIC/NCUA Insured | Not Bank/Credit Union Guaranteed | May Lose Value | Not Guaranteed by any Government Agency | Not a Bank/Credit Union Deposit
Securities and Advisory services offered through LPL Financial LLC, a Registered Investment Advisor
Member FINRA/SIPC
Tracking #1-526509 (Exp. 08/17)
Copyright © LPL Research


