Why New Highs in August Are Rare and Significant
by LPL Research
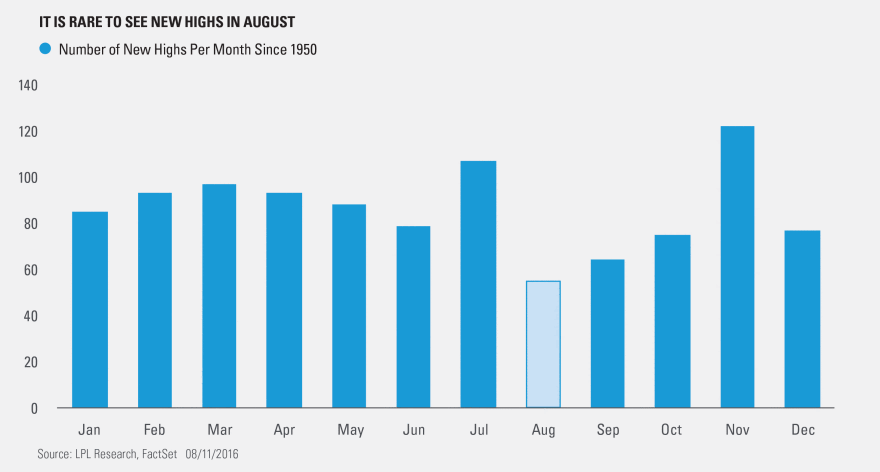
The S&P 500 made another new all-time high yesterday, the ninth since July 11—which was the first new high in nearly 14 months. Here’s where things get interesting, new highs are rather rare in this historically tough month of August. As we noted recently in the Weekly Market Commentary, “Time for an August Swoon?” August has been a very weak month going back in history and some of the largest drops tend to take place during this month.
Think about this, the S&P 500 had back-to-back new highs in August 2013 and 2014, but you’d have to go back to 1993 for the next time August saw back-to-back all-time highs. Looking at all months going back to 1950, August has had only 55 all-time highs ever (which comes out to 5.3% of all new highs), by far the lowest out of any month. In fact, there have now been 1,035 new highs since 1954. Remember, there was a 25-year gap between the 1929 high and September 1954.
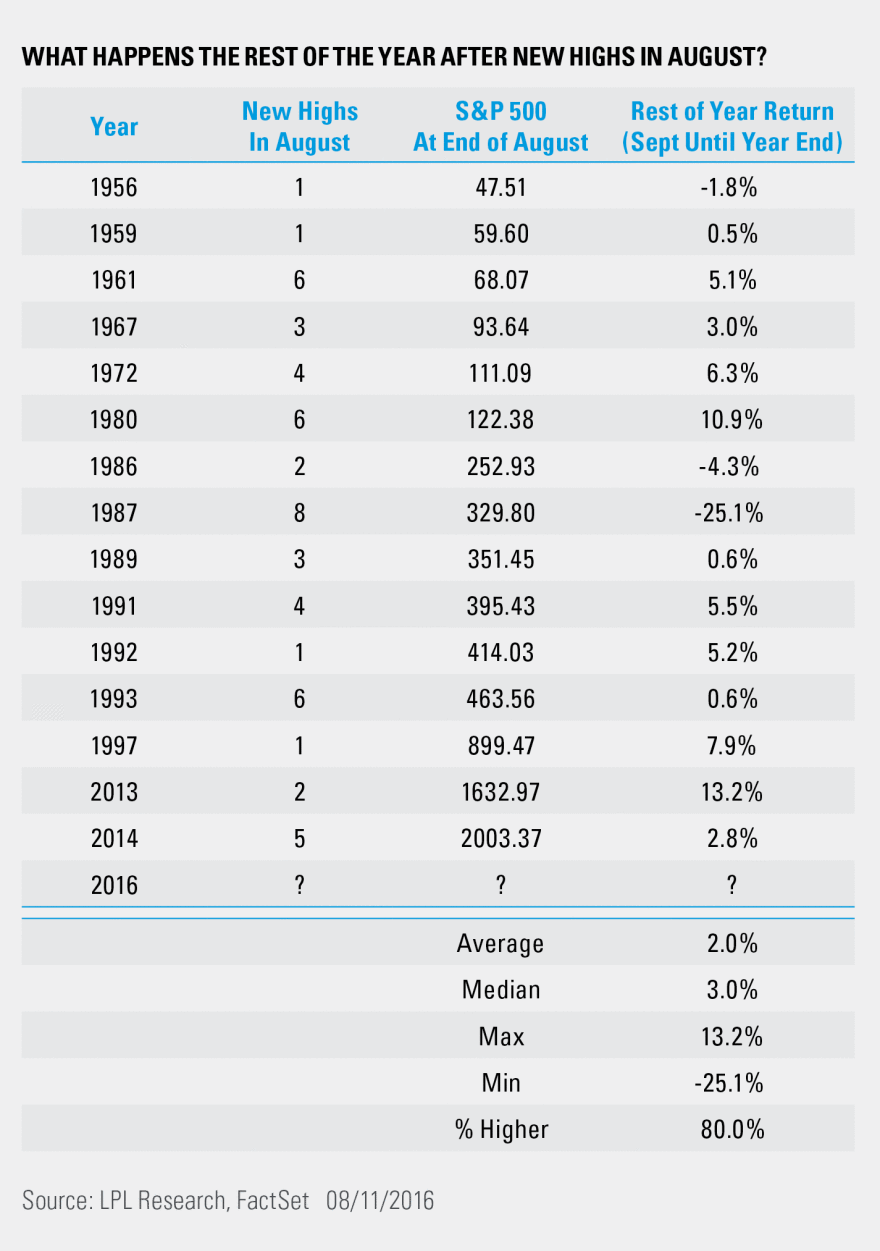
So, the next question is: What does it mean? If new highs are rare in August, is this some type of signal for what might happen the rest of the year? Since 1950, new highs were made in August 15 other times and the average return for the S&P 500 the rest of the year (September through end of December) was only 2.0%. This does jump up to a median return of 3.0%, mainly due to the 25.1% drop in 1987 having less weight. Now compare this to the 51 years when a new high wasn’t made during the month of August. The average return jumps to 4.1% (median return of 3.6%). Lately, it seems to be working better though, as the previous seven times (going back to 1989) a new high in August signaled that the rest of the year was higher, with an average return of 5.1%. Of course, going back eight times was in 1987, with a drop of 25.1% the rest of the year.
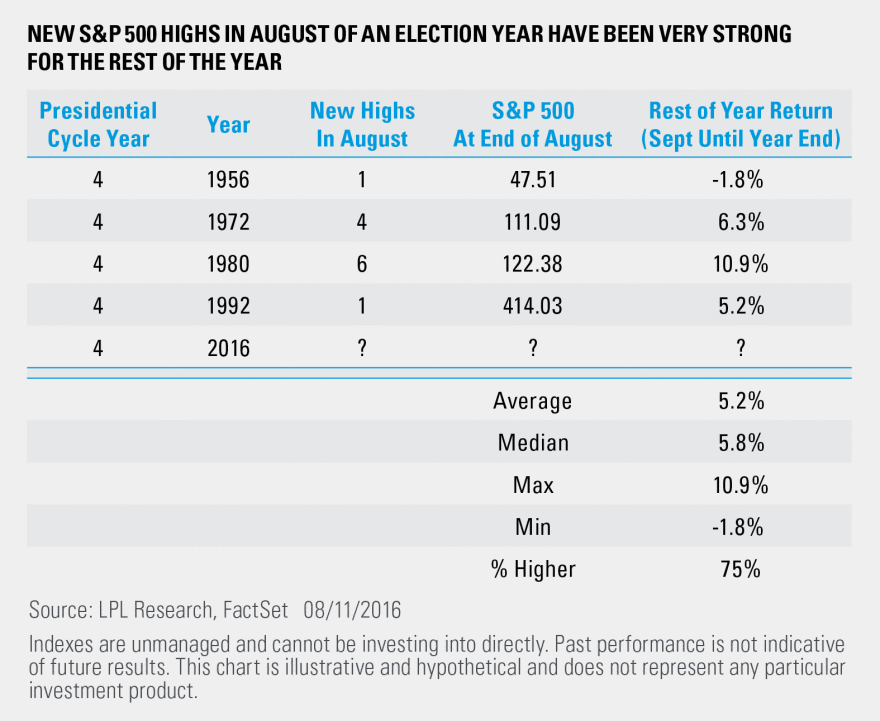
Lastly, what about when new highs are made in August during an election year? There is a very small sample size, but this has historically produced strong results going forward.
August tends to be a weak month, but when it isn’t weak, maybe that is telling us something. Returns have historically been mostly positive for the rest of the year, but below average. But new highs from this troublesome month during an election year could be a sign that a big pullback during the remainder of this year is unlikely. In fact, more potential strength could be in the cards.
***
IMPORTANT DISCLOSURES
Past performance is no guarantee of future results. All indexes are unmanaged and cannot be invested into directly.Unmanaged index returns do not reflect fees, expenses, or sales charges. Index performance is not indicative of the performance of any investment.
The economic forecasts set forth in the presentation may not develop as predicted.
The opinions voiced in this material are for general information only and are not intended to provide or be construed as providing specific investment advice or recommendations for any individual security.
Stock investing involves risk including loss of principal.
The S&P 500 Index is a capitalization-weighted index of 500 stocks designed to measure performance of the broad domestic economy through changes in the aggregate market value of 500 stocks representing all major industries.
This research material has been prepared by LPL Financial LLC.
To the extent you are receiving investment advice from a separately registered independent investment advisor, please note that LPL Financial LLC is not an affiliate of and makes no representation with respect to such entity.
Not FDIC/NCUA Insured | Not Bank/Credit Union Guaranteed | May Lose Value | Not Guaranteed by any Government Agency | Not a Bank/Credit Union Deposit
Securities and Advisory services offered through LPL Financial LLC, a Registered Investment Advisor
Member FINRA/SIPC
Tracking #1-525559 (Exp. 08/17)
Copyright © LPL Research


