Technically Speaking: Is This The Bottom For Oil Prices?
by Lance Roberts, Clarity Financial
In this past weekend’s newsletter, I reviewed the current state of the market and the problem for Janet Yellen holding off on hiking rates given the recent strength of employment data on the surface. I say on the surface, because if you dig just a little you will find the inherent problems as I noted.
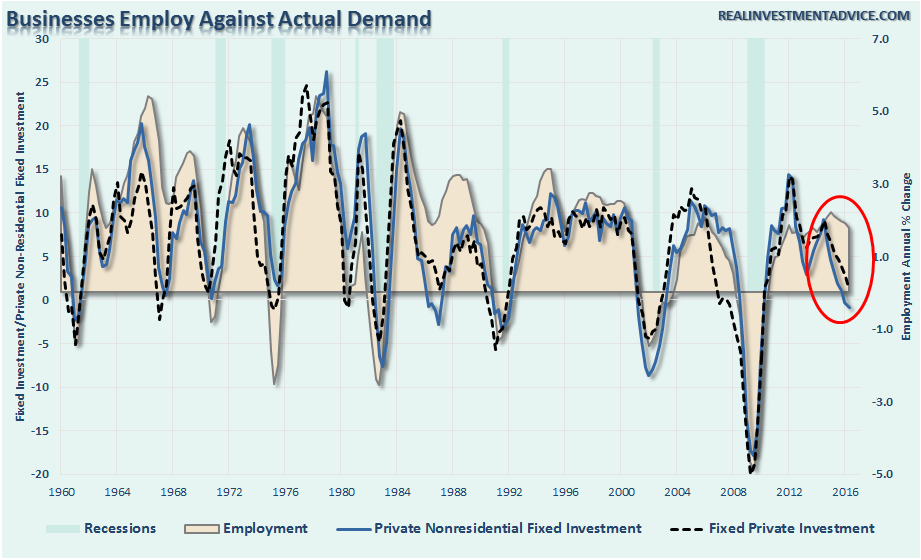
“The +85k unadjusted number also confirms the trends of fixed and non-private residential investment. Businesses hire against the demand for their products and services. This is why, as shown in the chart below, the historical relationship between employment and fixed investment is extremely high….until now.”
“Importantly, there are two takeaways from this data:
- Currently, the markets don’t care about what is really happening in the economy, but whether the data keeps the“punch bowl” available. Liquidity is key to supporting asset prices at current levels.
- However, eventually, the markets WILL care about this data when the economy slows to a point where recessionary forces are no longer deniable.
For now, we are not at the second point as of yet. Therefore, the bullish bias remains intact as long as Central Bankers remain accommodative and keeps interest rates suppressed. Of course, the ongoing liquidity push is distorting market dynamics to a point that will lead to some very bad things in the future.”
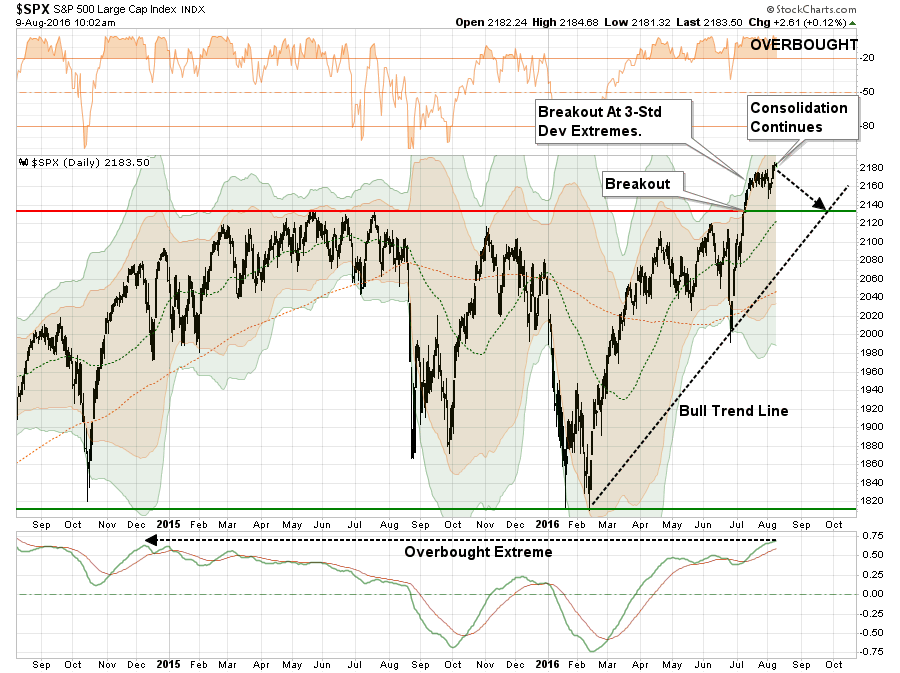
As I have noted over the past couple of weeks, the market continues in its process of digesting an extreme overbought condition. This is shown in the chart below.
The market, on a short-term basis, remains in extreme overbought territory. This needs to be relaxed somewhat before additional equity exposure is added to portfolios. As shown, a reversion to the current bullish trend line, which coincides with the markets recent breakout levels, is a likely target in the short-term.
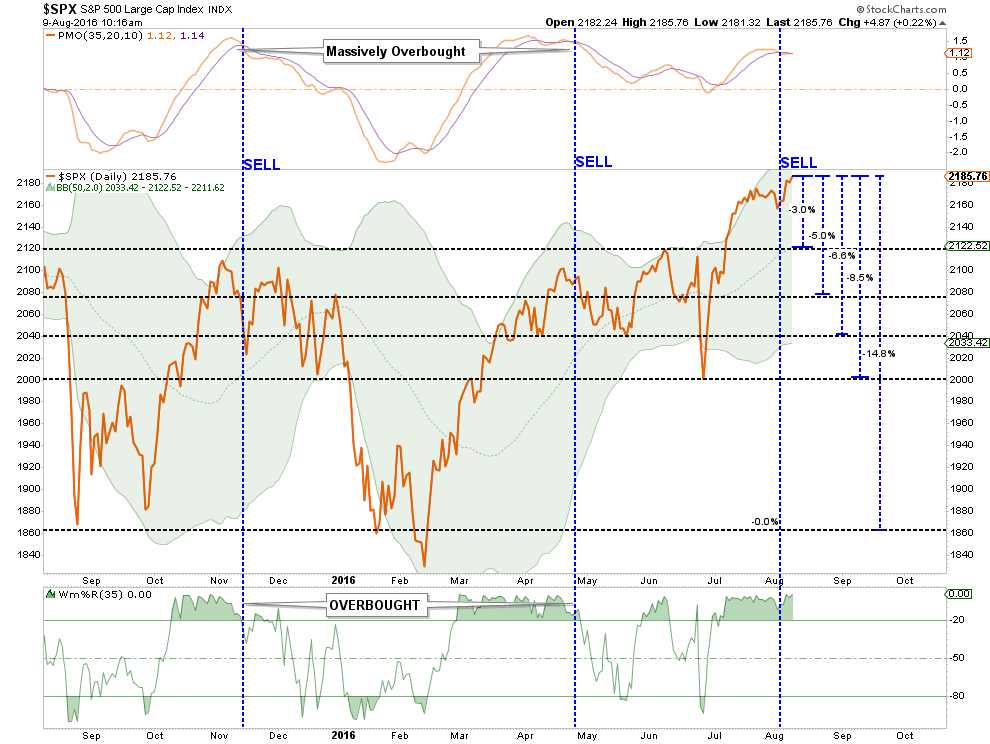
However, there is a more than reasonable chance, as I laid out two weeks ago for a deeper correction in the next 60-days. The chart below shows the potential drawdowns from current levels.
Here is the point. It would take a correction from current levels to break 2000, very important support for the markets currently, to even register a 10% correction. Given the current bullish exuberance for the market, this is probably unlikely between now and the election. Therefore, even a “worst case” correction currently would likely be an 8.5% drawdown back to major support. Of course, for most individuals, even such a small correction would likely feel far more damaging.
Such a correction back to support levels would reduce the current excessively overbought conditions and allow for further analysis of the risk/reward ratio of increasing equity exposure at that point. Of course, we will simply have to wait for the opportunity to present itself.
In the meantime, let’s talk about oil.
Is The Bottom For Oil Finally In?
If you have been reading my commentaries for very long, you are already aware that I live in Houston, Texas which is the energy capital of the world. While the Houston economy has transformed since the “oil bust” in the 80’s, do not be misled about the importance of energy as a critical support of the Houston economy.
Beginning in late 2013, I begin discussing on my daily radio show that it was likely time to begin evaluating energy based holdings and reducing some of the related risks. The reasoning then was simple: everything cycles. Therefore, as the adage goes, it was important to “make hay while the sun shines.”
As you can imagine, I was vilified for making such an outlandish commentary. I received literally hundreds of emails explaining the “new paradigm” in energy due to the “fracking revolution.” That emerging markets, primarily China, would continue to drive the demand for oil/energy for decades to come. It was all the usual arguments for why “this time is different.”
Then, in the June 2014 weekly newsletter, I made my first written call with respect to energy-related holdings as follows:
“In early May I set a target for oil prices at $106. That target has now been reached. With oil prices extremely overbought, now is a good time to profits in energy-related stocks. This is particularly the case in operators and drillers that are directly impacted by changes in oil prices.”
However, the most important warning came in early August of 2014.
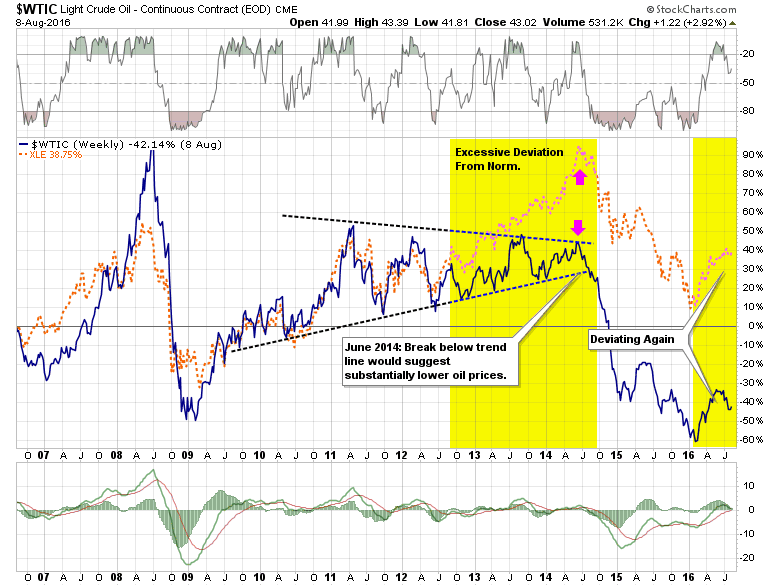
“While oil prices have surged this year on the back of geopolitical concerns, the performance of energy stocks has far outpaced the underlying commodity. The deviation between energy and the price of oil is at very dangerous levels. Valuations in this sector are also grossly extended from long-term norms.
If oil prices break below the consolidation channel OR a more severe correction in the markets occurs, the overweighting of energy in portfolios could lead to excessive capital destruction.”
Chart Updated To Current Levels
Unfortunately, my predictions in 2014 were correct.
With the deviation between energy stock prices and the underlying commodity once again deviated from their historical relationship, the pain is likely not over yet. With oil prices still overbought currently, and registering a short-term sell signal, the recent bounce is likely best used to sell into.
Valuable Lessons Learned & Relearned
August 2015:
“What this background teaches is, as always, ‘this time is not different.’ Investors have once again been taught the folly of performance chasing and the belief that fundamentals will trump human psychology in the short-term.
There is currently a growing belief that oil has reached a bottom in the low 40’s. Of course, that was also the belief a couple of months ago with oil was in the low 50’s. These beliefs currently appear to be based more on ‘hope’ rather than fundamental underpinnings.
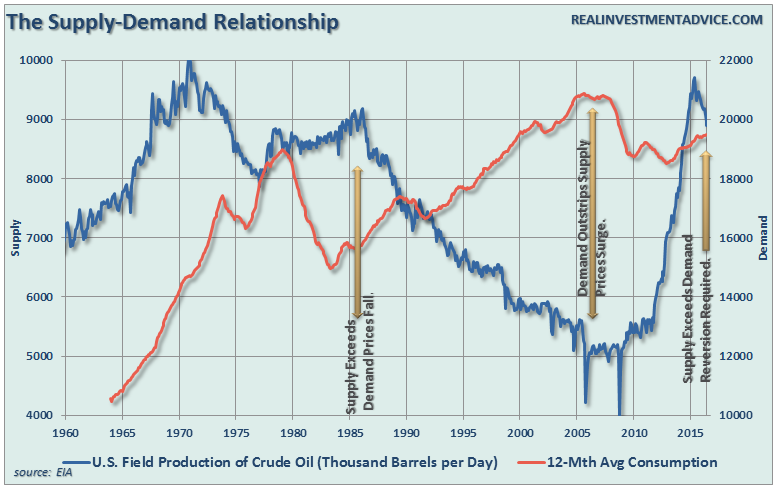
There is a basic supply/demand imbalance currently operating within the oil complex. As shown in the chart below, despite the collapse in oil prices and rig counts, supply has steadily grown over the last several months.”
One year later, that statement is as salient today as it was then.
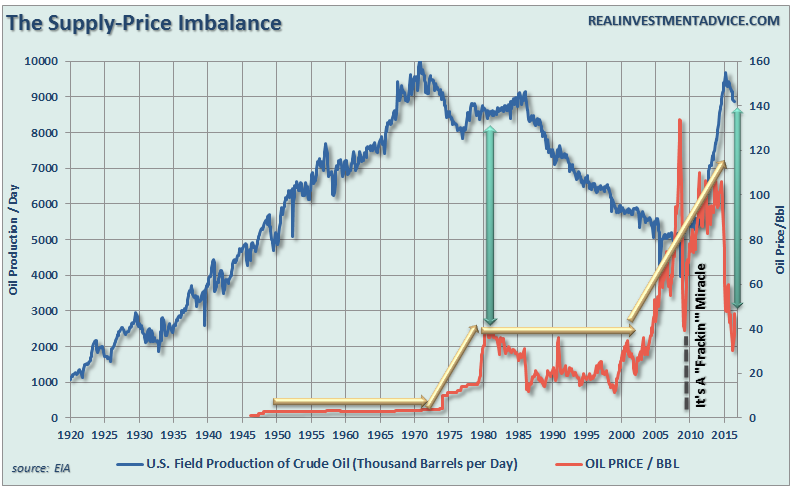
As shown above, the last time that supply was this high, it was the peak of oil prices for almost 20-years as the imbalance in supply was resolved. The subsequent surge in oil prices, from extremely suppressed levels of production, supported the push into the “fracking” boom and a massive surge in supply without a subsequent increase in the demand to consume it.
The ending was inevitable and just a function of timing. Importantly, the current surge in supply is once again exceeding a weakness in global demand. Given the current backdrop of the structural shift in employment dynamics and excessive indebtedness, it is unlikely that economic growth will accelerate to a point to markedly increase the demand side of the equation.
This suggests that oil prices may remain mired within a lower trading range for many years to come as the reversion process clears the excess supply overhang.
The problem for marginal industry players remains access to cheap capital has now been cut off, and even larger producers are having a tougher time obtaining capital. If oil prices remain at substantially lower levels in the months ahead, as I currently suspect (notwithstanding oversold bounces), there is likely going to be a good bit of turmoil in the energy space continuing into next year.
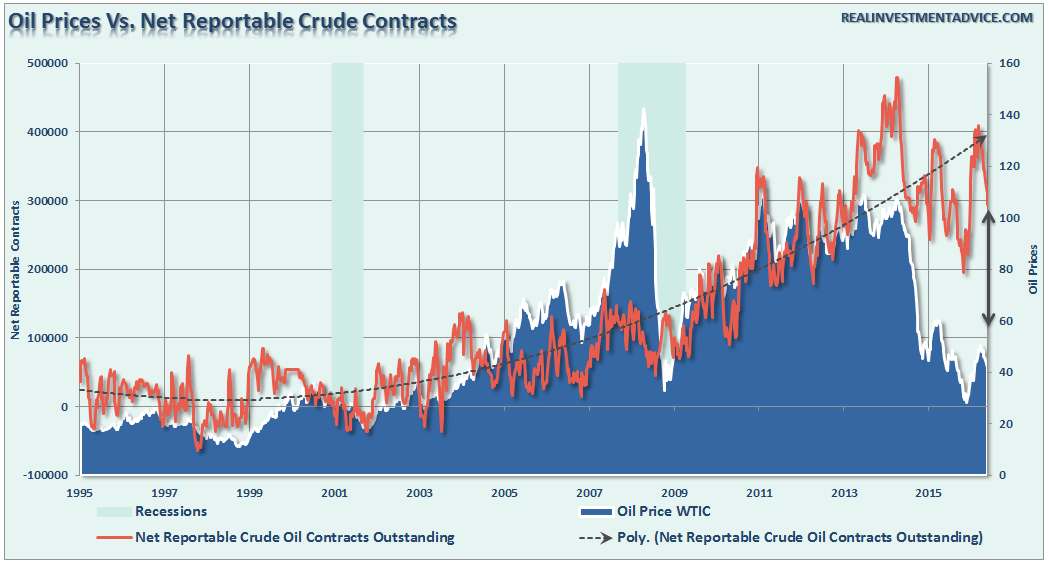
Currently, the number of net reportable contracts remains heavily biased to the long-side. If oil prices break $40/bbl, you should expect to see a rather rapid unwinding of contracts, and subsequently oil prices, to lower levels. I would suspect that my recent target of $30-35/bbl will prove very realistic.
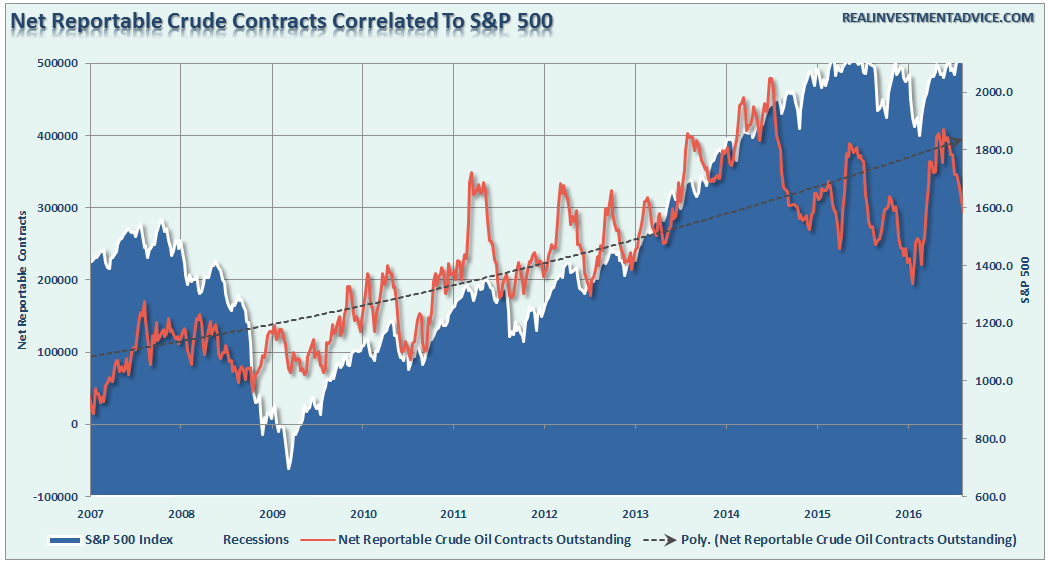
Furthermore, there is a high correlation between oil contracts and the S&P 500 historically speaking.
The current deviation between the S&P 500 and oil contracts will likely not last long. Either the S&P 500 is due for a more meaningful correction, as discussed above, or there is about to be a rapid rise in oil prices. The latter is unlikely.
I certainly understand the “temptation” to jump into the beaten down energy space currently, I would recommend only doing so in small amounts and with a very long time horizon measured in years rather than months.
The supply/demand dynamics currently suggest that oil prices and energy-related investments could find a long-term bottom within the next year or so following the next recession. However, it does not mean those investments will repeat the run witnessed prior to 2008 or 2014. Such is the hope of many investors currently as their “recency bias” tends to overshadow the potential of the underlying fundamental dynamics.
I am suggesting that an argument can be made that oil prices could remain range-bound for an extremely long period of time as witnessed in the 80’s and 90’s. It is here that lessons learned in the past will once again be re-learned with respect to the dangers of commodities, fundamentals, leverage and greed.
For the Houston economy, there is likely more pain to go through before we reach the end of this current cycle. There are still far too many individuals chasing yields in MLP’s and speculating on bottoms in energy-related companies to suggest a true bottom has been reached.
Lance Roberts is a Chief Portfolio Strategist/Economist for Clarity Financial.


