Wait until you get a pitch right where you want it!
April 25, 2016
by Jeffrey Saut, Chief Investment Strategist, Raymond James
One of the most successful investors in history received the only A+ from Professor Benjamin Graham (of Graham and Dodd “Security Analysis” fame) at Columbia: the chairman and chief executive officer at Berkshire Hathaway, Inc., which traded as low as $38 per share in the early 1970s and now trades around $219,000 per share. If you haven’t guessed who by now, it’s Warren Buffett. How does he do it? Well, the following are excerpts from financial media interviews back in the late 1980s:
“The most important quality for an investor is temperament, not intellect. You don’t need tons of IQ in this business. You don’t have to be able to play three dimensional chess or duplicate bridge. You need a temperament that neither derives great pleasure from being with the crowd or against the crowd. You know you’re right, not because of the position of others, but because your facts and your reasoning are right. . . . Most investors do not really think of themselves as owning a piece of the business. The real test of whether you are investing from a value standpoint or not is whether you care if the stock market opens tomorrow. If you’ve made a good investment, it shouldn’t bother you if they close down the stock market for five years. You own a piece of business at the right price and that’s what’s working for you. . . . In 30 years of investing I have never bought a technology company. I don’t have to make money in every game. There all kinds of things I don’t know about—like cocoa beans. But, so what! I don’t have to know about everything. The securities business is the perfect business. Every day you literally have thousands of the major American corporations offered you at a price, and a price that changes daily, and nothing is forced upon you. There are no called strikes in the business. The pitcher just stands there and throws balls at you and you can let as many go by as you want without a penalty. In real baseball, if the ball is between the knees and the shoulders, you either swing or you get a strike called on you. If you get three strikes, you’re called out. In the securities business, you stand there and they throw U.S. Steel at $28 and General Motors at $80, and you don’t have to swing at any of them. They may be wonderful pitches, but if you don’t know enough, you don’t have to swing. And you can stand there and watch thousands of pitches, and finally you get one right there where you want it, something that you understand and is priced right – and then you swing . . .”
On many occasions I have said, “The rarest thing on Wall Street is patience!” That quote is akin to Buffett’s quote, “If you don’t know enough, you don’t have to swing.” For most of last year, we didn’t “swing.” Then, in late August, our model told us to “swing” and we did. That was the week of the August 24, 2015 “lows” around 1800 on the S&P 500 (SPX/2091.58). The next time we “swung” was on December 11, 2015 when our model called for a “rip your face off” rally. About a week and a half later, we had to admit that was a bad “call.” In this business, when you are wrong, you admit it quickly for a de minimis loss of capital. So we came into 2016 with a defensive stance. But on Friday, February 5, CNBC’s Becky Quick asked me what the model was “saying” now. I responded, “It is saying we bottom next week” and we are tilting accounts according. It was during that week (February 11 to be exact) the SPX retested its August 2015 “lows” and the rest, as they say, is history. So where does this leave us now?
Well, the consensus “call” is that we are either making a “top” followed by a big decline or we are at the top of the trading range that has been intact since October 2014 (~1800 - ~2130) and now the SPX is headed back down. That view is reflected in this excerpt from our friends at the Boston-based Fidelity organization: “While this rally may continue to play out, the stock market may not break out of its year-long trading range until earnings growth stabilizes and the policy divergence between the Fed and other central banks ends.”
We are not of that view. Our work suggests the SPX will break out to the upside of the over-one-year trading range. As stated in prior missives, “To me, this feels very much like 2013 where the markets ground down every short seller into the May timeframe before a near-term top arrived. If that pattern plays here, it would fit nicely with my internal energy indicator, whose energy would be totally used up by mid-May. It still feels like new highs to me.”
And maybe, just maybe, the S&P Total Return Index is pointing the way higher as it traded to new all-time highs while the D-J industrials notched new reaction highs (INDU/18003.75). Now, if the D-J Transports (TRAN/8085.98) can better its November 2015 closing high of 8301.80, we will have a Dow Theory “buy signal.” If not, it will be an upside non-confirmation and likely lead to a pullback in stocks. If the Trannies are going to make a new reaction high, it will have to come quickly, because as stated, by mid-May, the equity market’s internal energy should be totally used up.
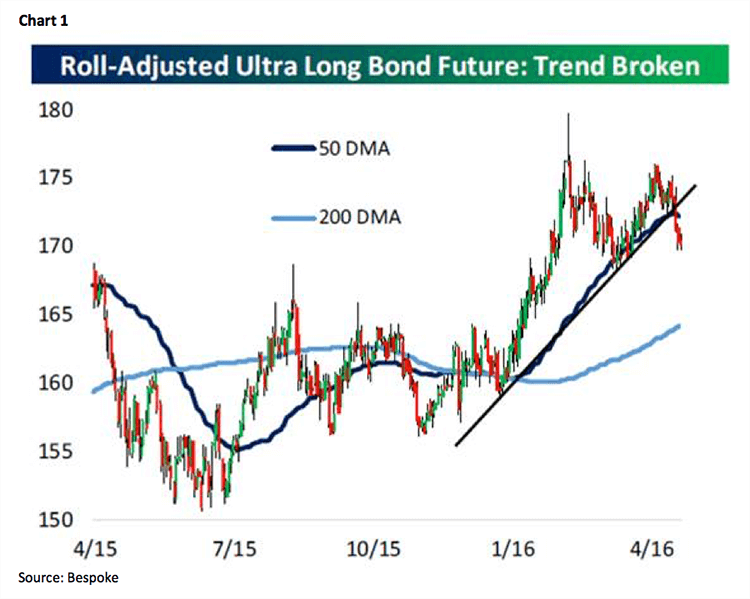
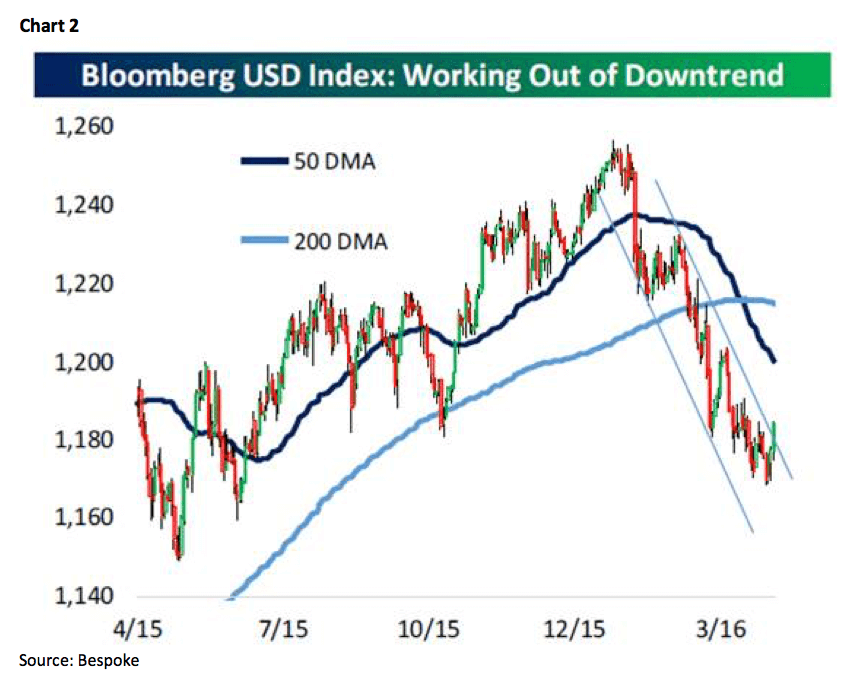
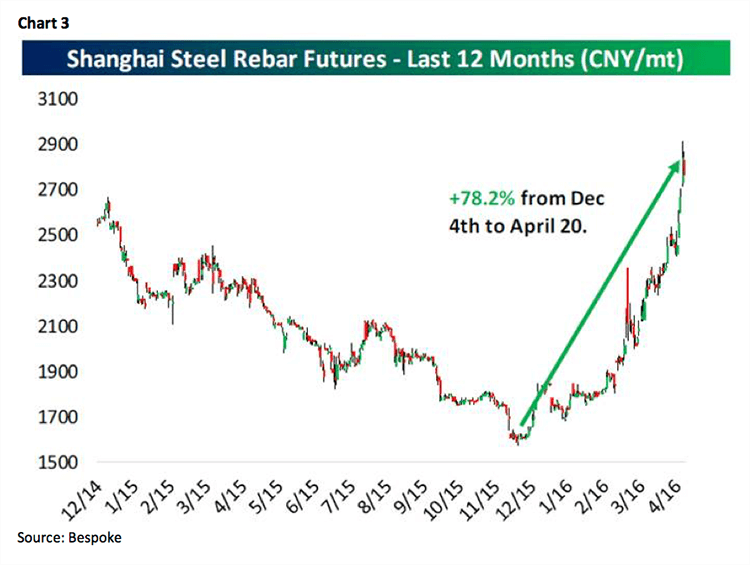
As for earnings season, while it is still a small sample of the S&P 500 companies that have reported 1Q16 earnings, 78.3% have beaten their lowered estimates (as of last Thursday). That is the best showing since 3Q09 and much better than the past few quarters. There have been some high-profile company “misses,” but the operative word (at least so far) for this earnings season is “beat.” Perhaps the better-than-expected earnings season is telegraphing stronger GDP numbers in the months ahead, although last week’s economic reports were on the softer side. This week, we get a slew of economic reports (Durable Goods, GDP, Core PCE, etc.) as well as the FOMC meeting. As I have repeatedly stated, IMO, if the Fed doesn’t raise rates this week, I doubt if they raise rates until after the election. However, the bond markets seem to think something’s afoot as the Roll-Adjusted Ultra Long Bond Future has broken down in the charts suggesting higher interest rates (chart 1). And, that could be what caused the Bloomberg US Dollar Index to try and reverse it downtrend (chart 2). Or maybe the interest rate complex is anticipating stronger GDP growth in China where energy and electricity consumption is strengthening and things like the Shanghai Steel Rebar Futures are surging (chart 3). It is also worth noting that, last week, Schlumberger said the crude oil surplus would be gone by year’s end and Caterpillar sees its business bottoming globally.
The call for this week: Well, today is actually session 50 (I miscounted when I said last Friday was session 48, because I failed to account for one of the holidays) in the second-longest “buying Stampede” I have ever seen. As SentimenTrader’s cerebral Jason Goepfert writes, “The S&P 500 has gone 10 weeks since trading below a prior week's low. This is the longest such streak since 2011 and among the most impressive since 1928.” That skein has left most of the macro sectors overbought. We are also within a week of the month of May where the market’s internal energy wanes. We have been steadfastly bullish since our model telegraphed the SPX would bottom the week of February 8; however, while we do expect an upside breakout by the SPX to new all-time highs, we are not real excited about adding to the many stocks featured in these reports since those February lows. In fact, according to one particularly brainy colleague, “Everything is expensive except emerging markets.” This morning, futures are flat as participants await the Fed meeting.


