A Closer Look At Growth and Value Indices
by Nathan Faber, Newfound Research
In a commentary a few weeks ago entitled Growth Is Not “Not Value,” we discussed a problem in the index construction industry in which growth and value are often treated as polar opposites. This treatment can lead to unexpected portfolio holdings in growth and value portfolios. Specifically, we may end up tilting more toward shrinking, expensive companies in both growth and value indices.
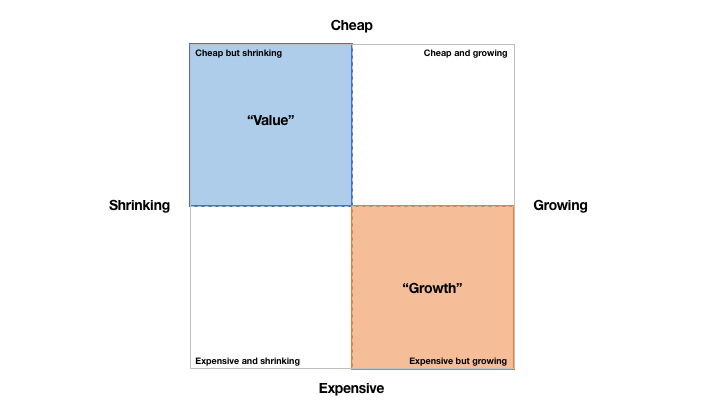
The picture of what we want for each index looks more like this:
The overlap is not a bad thing; it simply acknowledges that a company can be cheap and growing, arguably a very good set of characteristics.
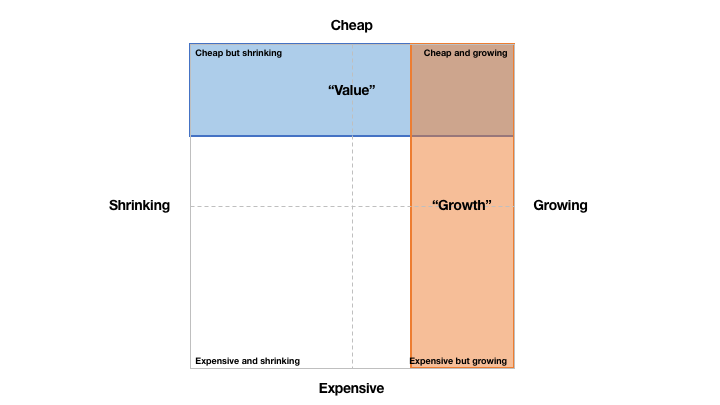
A common way of combining growth and value scores into a single metric is to divide growth ranks by value ranks. As we showed in the previous commentary, many index providers do something similar to this.
Essentially this means that low growth gets lumped in with high value and vice versa.
But how much does this affect the index allocations? Maybe there just are not many companies that get included or excluded based on this process.
Let’s play index provider for a moment.
Using data from Morningstar and Yahoo! Finance at the end of 2015, we can construct growth and value scores for each company in the S&P 500 and see where they fall in the growth/value planes shown above.
To calculate the scores, we will use an approach similar to the one in last commentary where the composite growth score is the average of the normalized scores for EPS growth, sales growth, and ROA, and the composite value score is the average of the normalized scores for P/B, P/S, and P/E ratios.
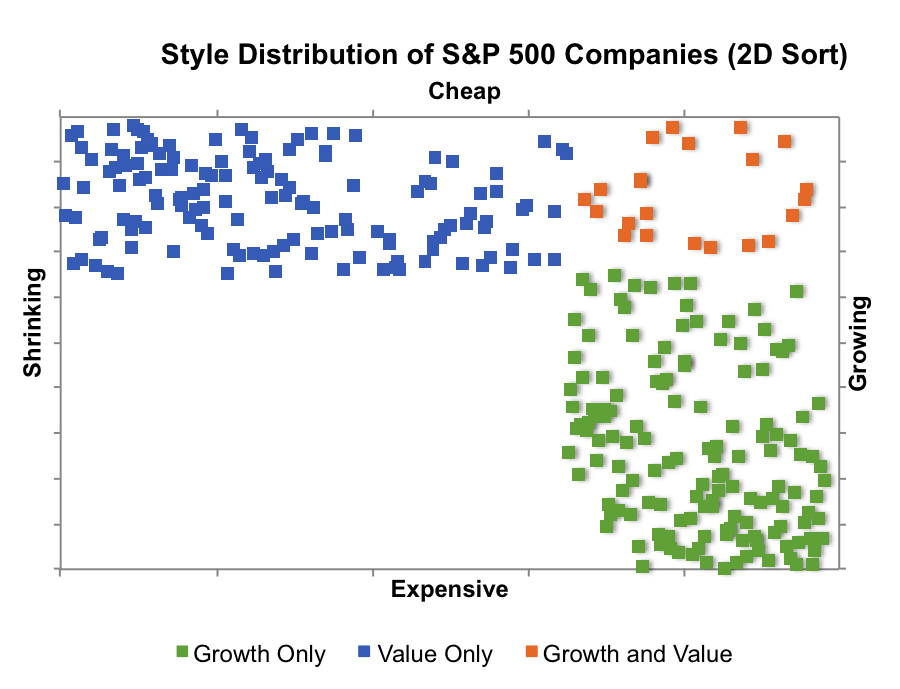
The chart below shows the classification when we take an independent approach to selecting growth and value companies based on those in the top third of the ranks.
In each class, 87% of the companies were identified as only being growth or value while 13% of companies were included in both growth and value.
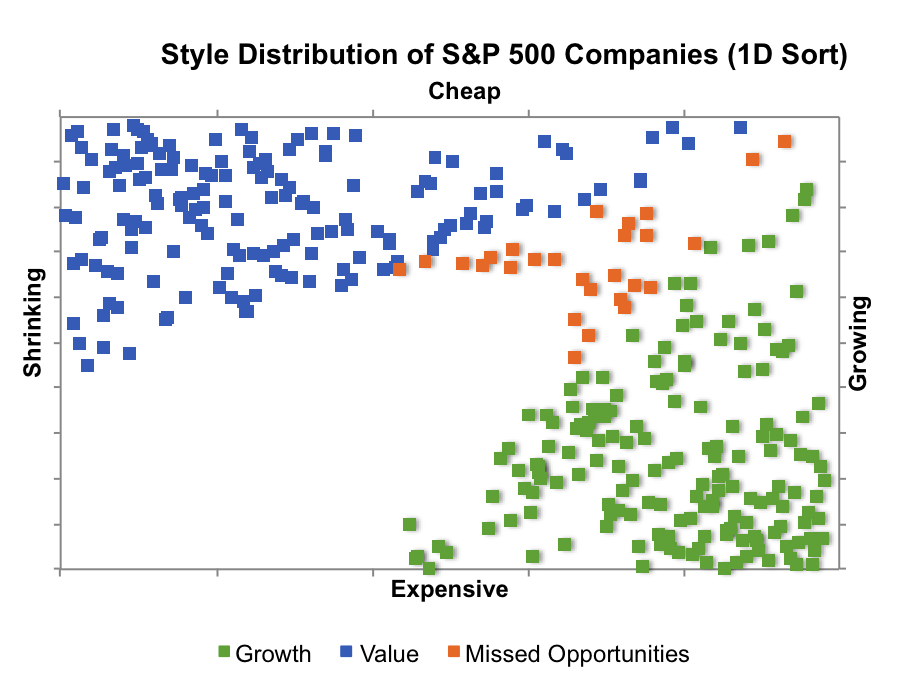
The next chart shows the classifications when we use the ratio of growth to value ranks as a composite score and again select the top third.
Relative to what we saw previously, growth and value now extend further into the non-value (expensive) and non-value (cheap) realms of the graph, respectively.
There is also no overlap between the two categories, but we are now missing 16% of the companies that we had identified as good growth or value candidates before. On the flip side, 16% of the companies we now include were not identified as growth or value previously in our independent sort.
If we trust our independent growth and value ranking methodologies, the combined growth and value metric leaves out over a third of the companies that were classified as both growth and value. These companies did not appear in either index under the combined scoring scheme.
With the level of diversification in some of these indices, a few companies may not make or break the performance, but leaving out the top ones defeats the purpose of our initial ranking system. As with the NCAA March Madness tournament (won by Corey with a second place finish by Justin), having a high seed may not guarantee superior performance, but it is often a good predictor (since 1979, the champion has only been lower than a 3 seed 5 times).
Based on this analysis, we can borrow the final warning to buyers from the previous commentary:
"when you're buying value and growth products tracking any of these indices, you’re probably not getting what you expect – or likely want."
… and say that the words “probably” and “likely” are definitely an understatement for those seeking the best growth and value companies based on this ranking.


