Shad Rowe
by Jeffrey Saut, Chief Investment Strategist, Raymond James
April 18, 2016
For years, when I was living in Virginia, I attended the annual Shad Planking. As described by Wikipedia (paraphrased):
The Shad Planking is an annual political event in Virginia, which takes place every April near Wakefield, Virginia. It is sponsored by a chapter of the Ruritans, a community service organization. Ostensibly the event is to celebrate the running of shad where the oily, bony fish are smoked for the occasion, nailed to wood planks, and then stuck in the ground around an open flame wood fire. The event began after WW II, and was long a function of the state's Conservative Democrats, whose political machine dominated Virginia politics for about 80 years (from the late 19th century until the 1960s). However both Virginia, and the Shad Planking, had evolved into a more bipartisan environment by the 1980s. In modern times, would-be candidates, reporters, campaign workers, and locals gather to eat shad, drink beer, smoke tobacco, and kick off the state's electoral season with lighthearted speeches by the politicians in attendance.
This morning, however, I am not referring to Virginia’s “Shad Planking,” but rather my friend Frederick “Shad” Rowe, captain of the Dallas-based money management firm Greenbrier Partners. Back in the 1970s/1980s I used to read Shad’s sage comments in Forbes Magazine, but regrettably he is no longer a contributor. He now writes an insightful letter to investors in his partnership every month, which I very much look forward to. This month’s letter was no exception. To wit:
Investing has always been a game of alternatives. What do we do with our money? Cash is not a reasonable answer because it is depreciating all the time. Bonds are not the answer either – with a 1.8% yield, a 10-year U.S. government bond trades at roughly the equivalent of a stock selling at more than 80x after-tax earnings. In comparison, the S&P 500 trades at approximately 18x expected earnings with a current dividend yield of 2.2%. It is worth noting that the bond’s interest payments are fixed, while S&P 500 earnings and dividends are likely to increase over time. The nature of real estate has changed – a new world is unfolding with people shopping online and working from home – and you still have limited liquidity. Sometimes the obvious answer is also the correct answer. The stock market is the obvious answer. It has generated superior returns over time. But the volatility scares most investors. Ultimately we believe that a broad spectrum of investors will reach the same conclusion that we reached long ago. After seven years of generally rising stock prices, we still have not seen the broad, enthusiastic participation that generally indicates market tops. For investors of most stripes, the stock market remains the only viable game in town – a game which many natural participants may have forgotten, but we trust will remember soon enough. And while stocks may not be cheap relative to where they trade at stock market bottoms, they remain very cheap relative to the other outlets for our hard-earned cash.
Obviously I agree with Shad and if S&P’s earnings estimates are close to the mark the S&P 500 (SPX/2080.73) is in fact trading at 17.6x this year’s estimate of ~$118. Yet if next year’s estimate of ~$136 is correct, the SPX is trading at 15.3x earnings. So as Shad eloquently points out, “while stocks may not be cheap relative to where they trade at stock market bottoms, they remain very cheap relative to the other outlets for our hard-earned cash.” Speaking to “cheap” stocks, last week the Financial sector soared with a weekly gain of 3.95%, and why not, for it is truly the cheapest sector out there. Indeed, the Financials trade at an earnings yield of 9.89% (earnings/price), possess an enterprise value to earnings before interest and taxes (EBIT) of 10.28, with an aggregate P/E multiple of 10.11x (see chart 1 on page 3). While most folks want to talk about the major banks, some of the names mentioned to me by various portfolio managers in NYC recently were more obscure. EverBank Financial (EVER/$15.19/Outperform) was one, as it provides a diverse range of financial products and services directly to clients nationwide through multiple business channels. A quick trip to EverBank’s website shows some of their unusual products, like CDs denominated in foreign currencies. The shares trade near book value, at roughly 10x our fundamental analyst’s earnings estimate for 2016, and with a 1.6% dividend yield. Other financial names mentioned, and with favorable ratings from our fundamental analysts, include: Pacific Premier Bancorp (PPBI/$20.85/Strong Buy); Q2 Holdings (QTWO/
$23.74/Outperform); BOFI Holdings (BOFI/$17.25/Strong Buy), which has sold off recently on a negative story from a salacious source; and Carolina Financial (CARO/$18.23/Outperform).
So the Financial sector “painted the tape” higher last week, potentially resolving the question I have heard from the negative nabobs for over a month, that being, “The overall stock market can’t rally without the financials rallying.” To be sure the consensus “call” has been for either a big decline for stocks, or the ubiquitous “call” for a continuation of a trading range. Ladies and gentlemen, I can make a cogent argument that the SPX has been trapped in a trading range since April 2014 between 1800 and 2130 (see chart 2). That’s over two years, which is about as long as a consolidation period lasts within a secular bull market. And yes Virginia, I still believe we are in a secular bull market that has years left to run!
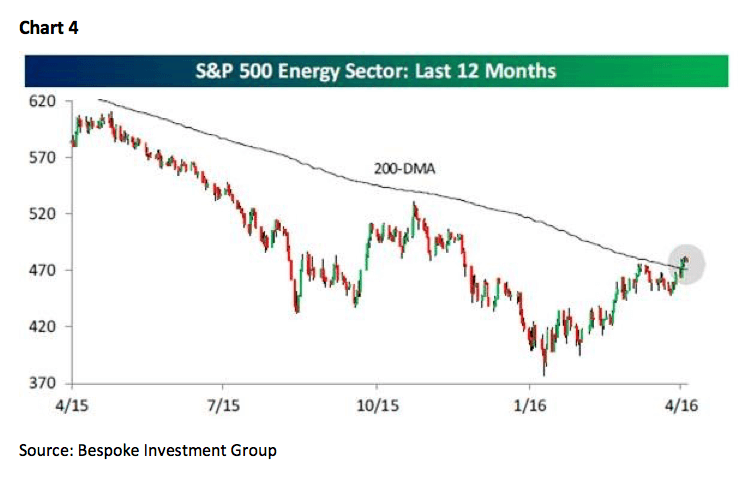
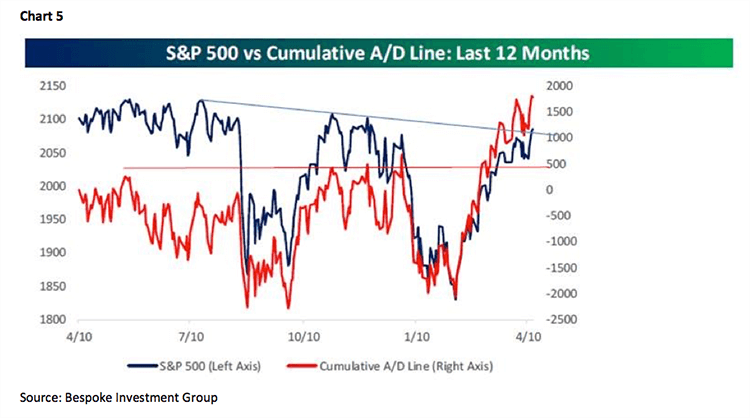
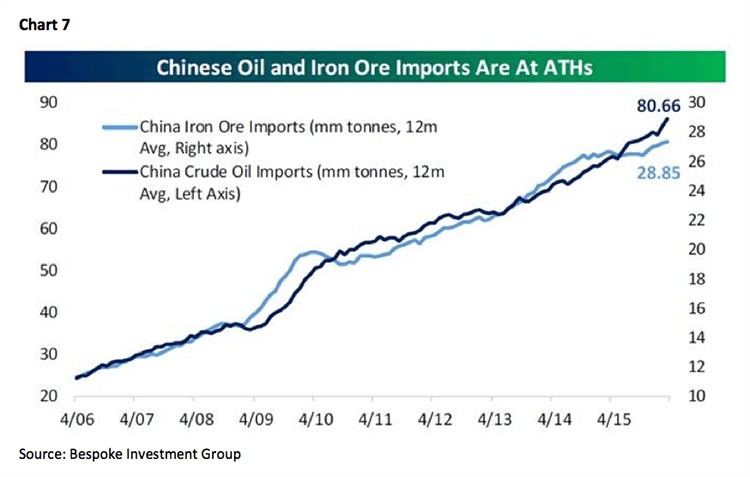
Our model “called” the low of February 11, 2016 and at the time we featured numerous stocks for your consideration in these reports. Since then, the SPX has gained ~15%, which has left the SPX testing its downtrend line in the charts that began last May (chart 3 on page 4). Of interest is that the economically sensitive D-J Transportation Average (TRAN/7978.23) has rallied a large ~20% from its January 20, 2016 low and may be pointing the way higher for the overall stock market. The Trannies’ rally is impressive given crude oil’s ~55% rally from its mid-February low. That “crude climb” has lifted the S&P 500 Energy Index ~22% (chart 4) with many of our energy stocks rallying significantly more than that. Ladies and gentlemen, such actions are not typical of what precedes a recession. Meanwhile, the cumulative Advance/Decline has broken out to new highs (chart 5 on page 5). As for the economic data, most of it has been on the softer side recently, implying interest rates should remain low. The exception to the economic malaise was last week’s Empire Manufacturing Report, which showed its third straight month of improvement (chart 6). China also showed renewed economic strength with iron ore and crude oil imports at all-time highs (chart 7 on page 6). Meanwhile, the dearth of bullish sentiment suggests a bottom for stocks is at hand (chart 8) and our proprietary measurement of the equity market’s internal energy has rebuilt to nearly a full charge, suggesting an upside breakout to new highs is likely in the cards. As for the alleged horrible earnings season, while it is a small sample, of the 49 companies in the S&P 500 that have reported 34 (69%) have exceeded estimates, eight have matched estimates, and seven have missed. Obviously, we will have a better sample by this Friday.
The call for this week: Today participants in the Boston Marathon will race for the finish line. Hopefully, the S&P 500 will race for its respective all-time high “finish line” of 2130.82 as well. The setup is certainly right given the aforementioned metrics and the historical precedent that stocks tend to do pretty well with the SPX gaining ground over 70% of the time the week, and month, following “tax day.” And as SentimenTrader’s perspicacious Jason Goepfert writes:
Stocks enjoyed a rare kind of breakout this week. As volatility compressed over the past month, the S&P 500's Bollinger Bands started squeezing together, and this week the index broke out above its upper Band. That was the first time in nearly 400 days it was able to do so, the 2nd-longest streak in its history. Generally, stocks did well after triggering a breakout like this after having gone a long time without one. The small-cap Russell 2000 is nearly above its 200-day average. The last of the four major stock indexes to climb above its long-term average, when the Russell ended a streak of at least six months below its average, it tended to continue to rally going forward. A new high in the Advance/Decline Line tends to lead to gains. In response to some questions regarding Thursday's Report on the A/D Line, when it moves to a multi-year high, the S&P 500's maximum loss at its worst point over the next year has averaged -3.9%.
Indeed, as we have been saying, “Buy the dips!” And this morning you are going to get another opportunity to buy the dips as there was no oil production cut at the Doha meeting, leaving oil down 4%, the preopening S&P futures off 6 points, and an earthquake in Japan has investors shaken, not stirred.
Copyright © Raymond James


