by Don Vialoux, Timingthemarket.ca
StockTwits Released Yesterday @equityclock
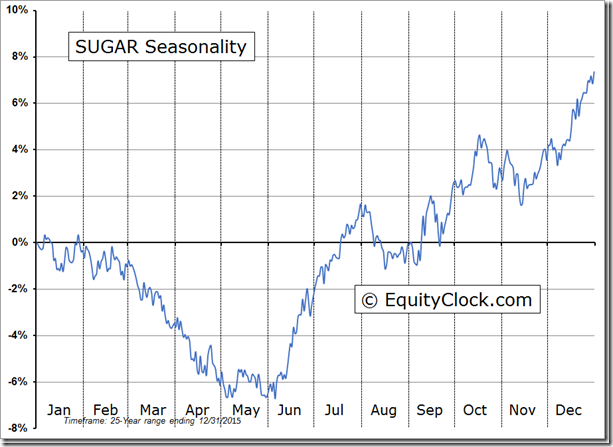
Price of sugar entering a seasonal strong period that runs through the end of July.
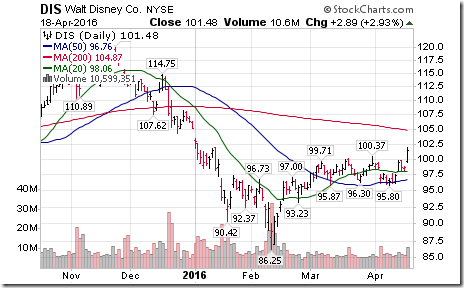
Technical action by S&P 500 stocks to 10:00: Quiet. Two stocks broke intermediate resistance: $JBHT and $DIS. None broke support.
Editor’s Note: After 10:00 AM, another 7 S&P 500 stocks broke intermediate resistance levels: PCLN, MCO, COP, IVZ, MSFT, IP and AVY.
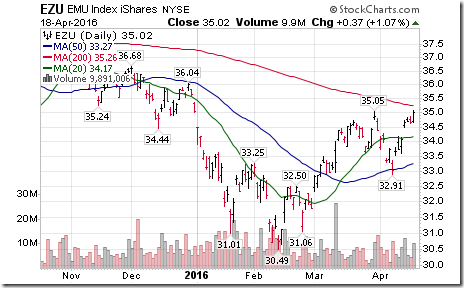
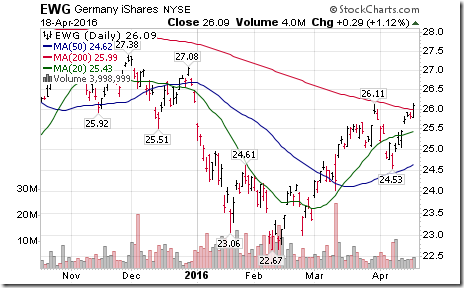
Europe ETFs are breaking out and extending intermediate uptrends on positive strength relative to the S&P 500.
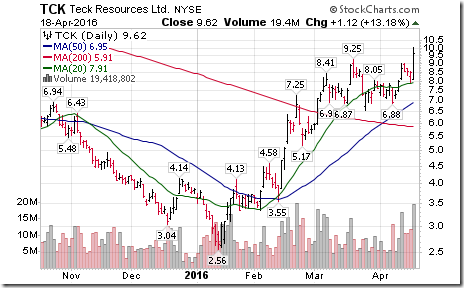
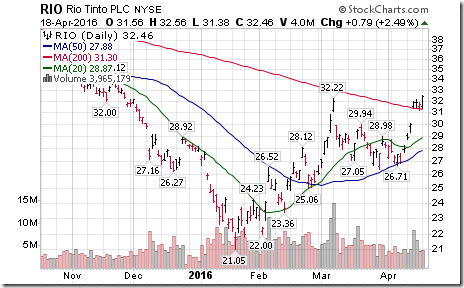
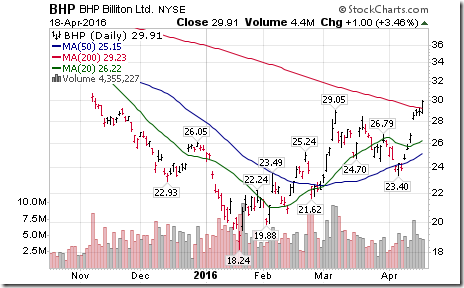
Selected base metal stocks $TCK $RIO $BHP are breaking to new highs extending intermediate uptrends.
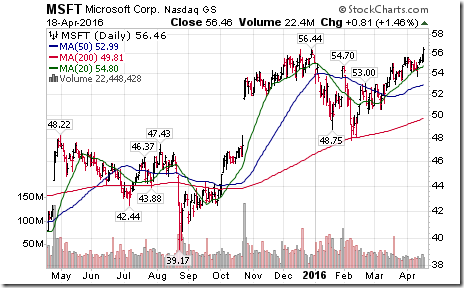
Microsoft $MSFT moved above resistance at $56.44 to reach an all-time high extending intermediate uptrend.
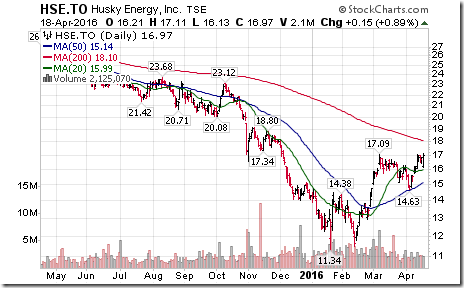
Nice breakout by Husky Energy $HSE.CA above resistance at $17.09 extending intermediate uptrend.
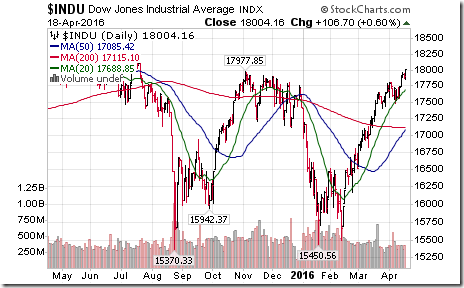
Dow Jones Industrial Average moved above resistance at 17,977.75 to reach a 9 month high. Ditto for $DIA!
Trader’s Corner
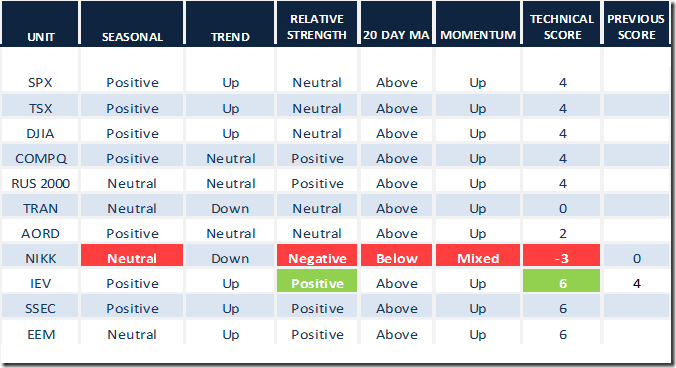
Daily Seasonal/Technical Equity Trends for April 18th 2016
Green: Increase from previous day
Red: Decrease from previous day
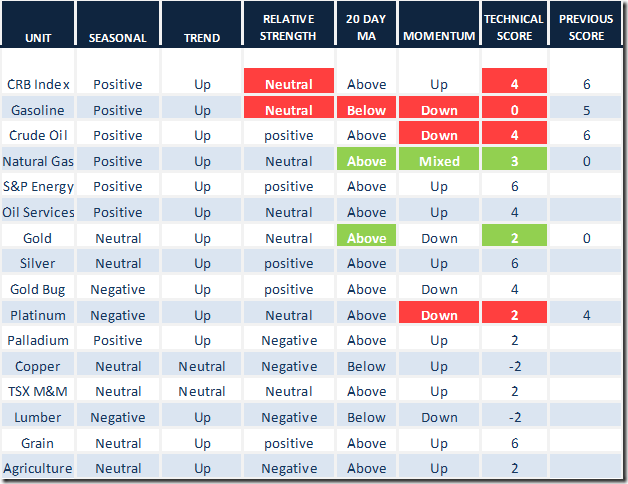
Daily Seasonal/Technical Commodities Trends for April 18th 2016
Green: Increase from previous day
Red: Decrease from previous day
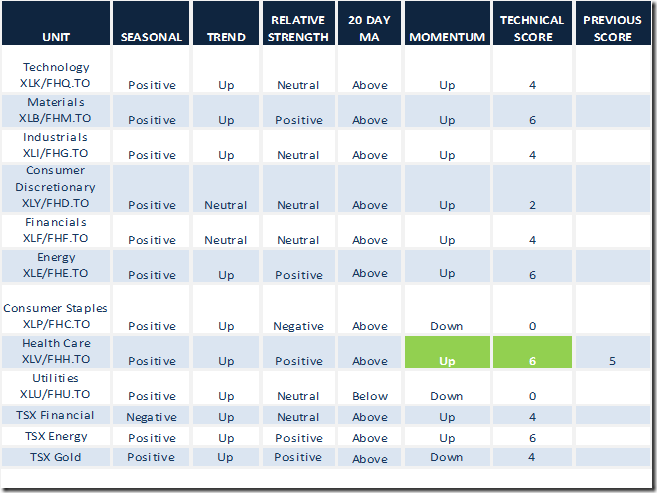
Daily Seasonal/Technical Sector Trends for March April 18th 2016
Green: Increase from previous day
Red: Decrease from previous day
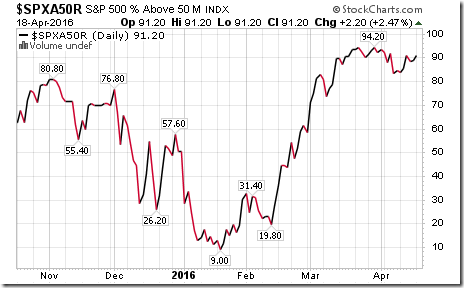
S&P 500 Momentum Barometer
Percent increased slightly yesterday, but remains intermediate overbought
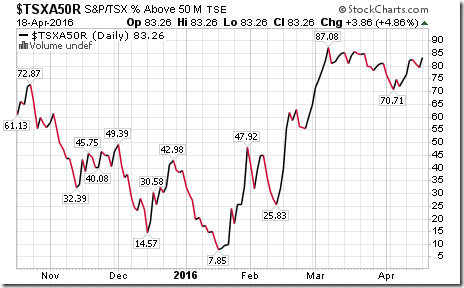
TSX Composite Momentum Barometer
Percent increased slightly yesterday, but remains intermediate overbought
Interesting Charts
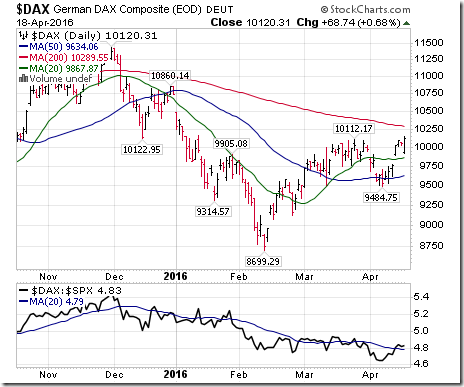
Nice breakout by the DAX Index above 10,112.17 to complete a modified reverse head and shoulders pattern! The Index is showing early signs of outperformance relative to the S&P 500 Index
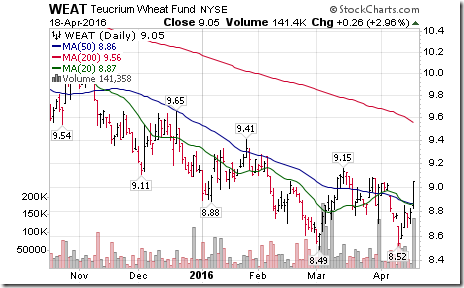
Grain prices continue to surge higher.
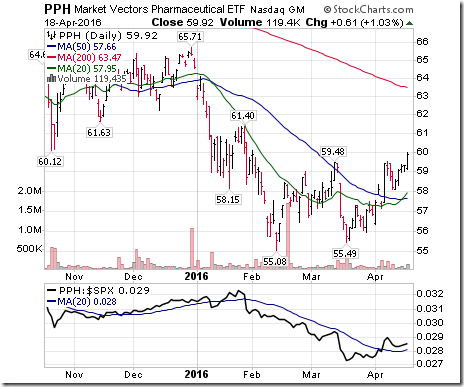
Market Vectors Pharmaceutical ETF completed a double bottom pattern on a move above $59.48
Special Free Services available through www.equityclock.com
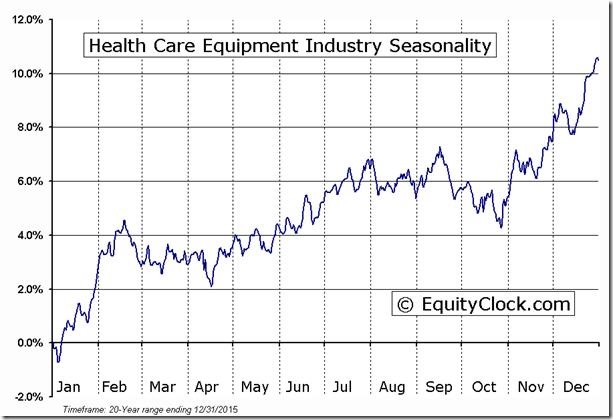
Equityclock.com is offering free access to a data base showing seasonal studies on individual stocks and sectors. The data base holds seasonality studies on over 1000 big and moderate cap securities and indices. To login, simply go to http://www.equityclock.com/charts/ Following is an example:
Disclaimer: Seasonality and technical ratings offered in this report by www.timingthemarket.ca and www.equityclock.com are for information only. They should not be considered as advice to purchase or to sell mentioned securities. Data offered in this report is believed to be accurate, but is not guaranteed


