by Don Vialoux, Timingthemarket.ca
Don Vialoux on BNN
Don Vialoux is scheduled to be the guest analyst on Berman’s Call at 11:00 AM today.
Economic News This Week
Third estimate for third quarter U.S. GDP to be released at 8:30 AM EST on Tuesday is expected to be revised downward to growth at 1.9% from the previous estimate of growth at 2.1%.
November Existing Home Sales to be released at 10:00 AM EST on Tuesday are expected to slip to 5.34 million units from 5.36 million units in October.
November Durable Goods Orders to be released at 8:30 AM EST on Wednesday are expected to dip 0.2% versus a gain of 2.9% in October. Excluding Transportation, Orders are expected to be unchanged versus a gain of 0.5% in October.
November Personal Income to be released at 8:30 AM EST on Wednesday is expected to increase 0.2% versus a gain of 0.4% in October. November Personal Spending is expected to increase 0.3% versus a gain of 0.1% in October
Canadian October Retail Sales to be released at 8:30 AM EST on Wednesday are expected to increase 0.04% versus a decline of 0.5% in September
Canadian October GDP to be released at 8:30 AM EST on Wednesday is expected to increase 0.3% versus a decline of 0.5% in September.
December Michigan Sentiment to be released at 10:00 AM EST on Wednesday is expected to increase to 92.0 from 91.8 in November
November New Home Sales to be released at 10:00 AM EST on Wednesday are expected to increase to 505,000 from 495,000 in October.
Weekly Initial Jobless Claims to be released at 8:30 AM EST on Thursday are expected to drop to 265,000 from 271,000 last week.
Earnings News This Week
Tuesday: Conagra, Micron, Nike, Paychex
The Bottom Line
Another wild week for North American equity indices last week! Volatility likely peaked last week. The stage is set for a classic Santa Claus rally. Primary sectors with positive seasonality at this time of year that will most benefit are Materials, Financials, Industrials and Technology. Subsectors with positive seasonality include and improving technical prospects include Biotech, Semiconductors, Medical Devices, Home Builders, Forest Products and Aerospace & Defense. Commodities with positive seasonality and improving technical prospects include Silver, Platinum and Palladium. Bonus events that are unique during the current Santa Claus rally period include an intermediate peak in the U.S. Dollar Index, a positive impact on equity markets of an El Nino weather event and anticipation of a return to earnings and revenue growth beyond the release of fourth quarter results. The stage is set for continuation of an intermediate recovery in North American equity markets that started last week and is expected to continue into spring.
Equity Indices
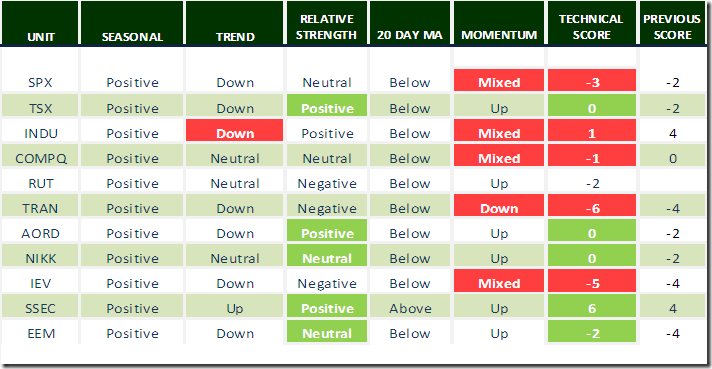
Weakness in equity market indices on Friday triggered a decline in Technical Score with most of the damage coming from a drop by short term momentum indicators.
Daily Seasonal/Technical Equity Trends for December 18th 2015
Green: Increase from previous day
Red: Decrease from previous day
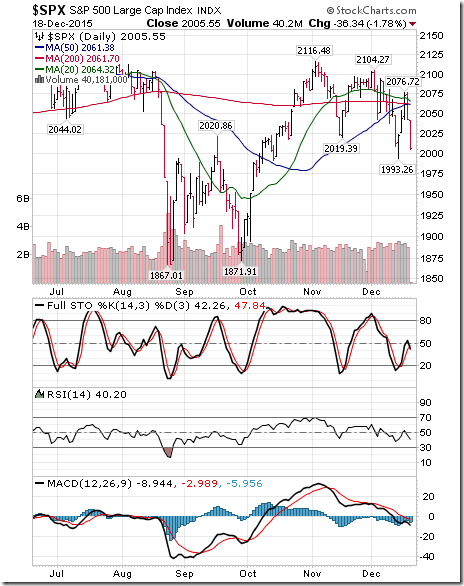
S&P 500 Index slipped 6.82 points (0.34%) last week. Intermediate trend remains down. The Index remains below its 20 day moving average. Short term momentum indicators have turned mixed from up.
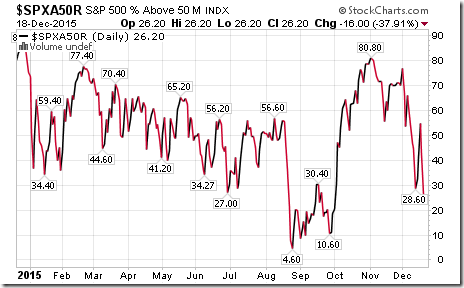
Percent of S&P 500 stocks trading above their 50 day moving average dropped to 26.20% from 28.60% last week. Percent is trending down and intermediate oversold, but has yet to show signs of bottoming. Historically, a recovery from near current levels has triggered the start of an intermediate recovery by the S&P 500 Index.
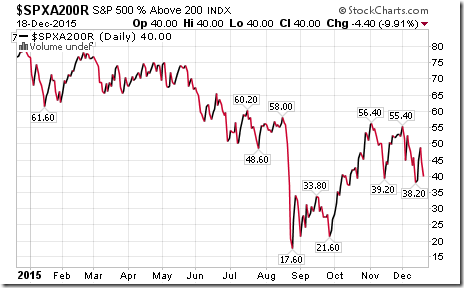
Percent of S&P 500 stocks trading above their 200 day moving average increased last week to 40.00% from 38.20%. Percent is trending down and is oversold.
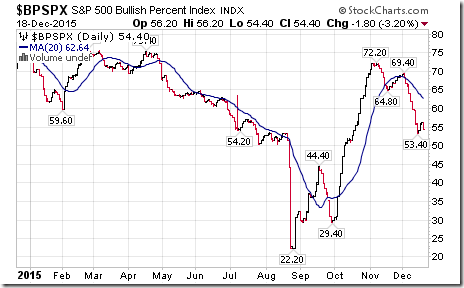
Bullish Percent Index for S&P 500 stocks slipped to 54.40% from 55.60% and remained below its 20 day moving average. The Index remains in an intermediate downtrend.
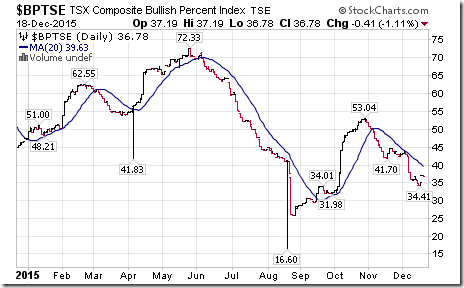
Bullish Percent Index for TSX stocks increased last week to 36.78% from 36.03% and remained below its 20 day moving average.
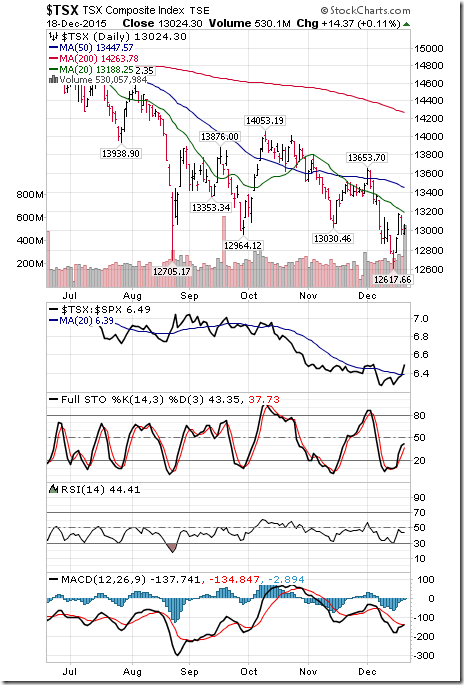
The TSX Composite Index added 234.35 points (1.83%) last week. Intermediate trend remains down (Score: -2). Strength relative to the S&P 500 Index changed to Positive from Negative (Score: 2). The Index remains below its 20 day moving average (Score: -1). Short term momentum indicators are trending up (Score: 1). Technical score improved to 0 from -6.
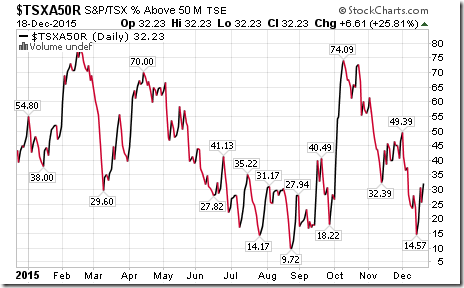
Percent of TSX stocks trading above their 50 day moving average improved to 32.23% from 23.89% after reaching a low of 14.57%. Recoveries from below the 20% level frequently occur after when the Index has passed an intermediate low.
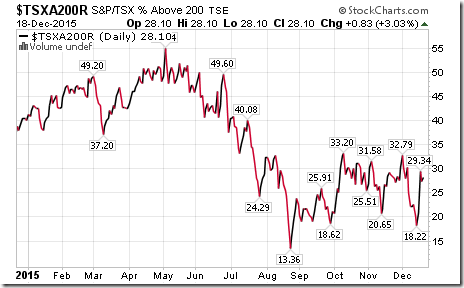
Percent of TSX stocks trading above their 200 day moving average increased last week to 28.10% from 20.24%. Percent likely reached an intermediate low last week.
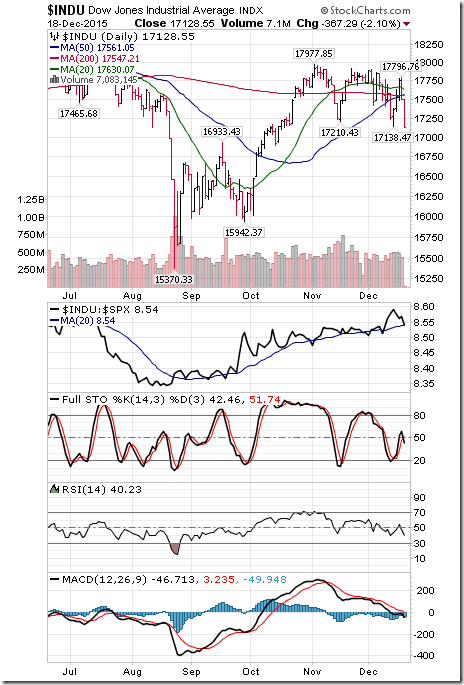
The Dow Jones Industrial Average lost 136.66 points (0.79%) last week. Intermediate trend changed to down from up on a move below 17,210.43. Strength relative to the S&P 500 Index remains positive. The Average remains below its 20 day moving average. Short term momentum indicators are mixed. Technical score dropped last week to 1 from 2.
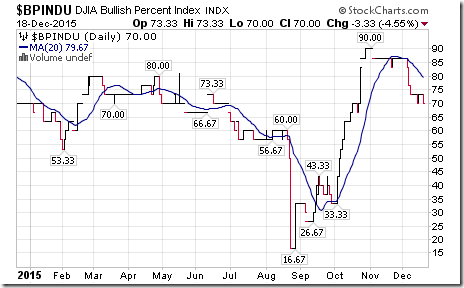
Bullish Percent Index for Dow Jones Industrial Average stocks slipped last week to 70.00% from 73.33% and remained below its 20 day moving average. The Index remains intermediate overbought and trending down.
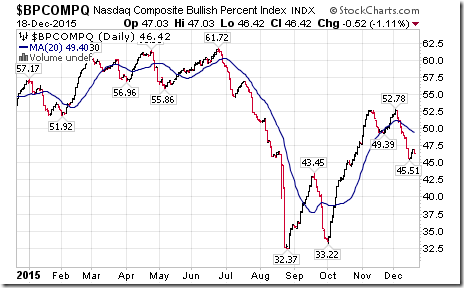
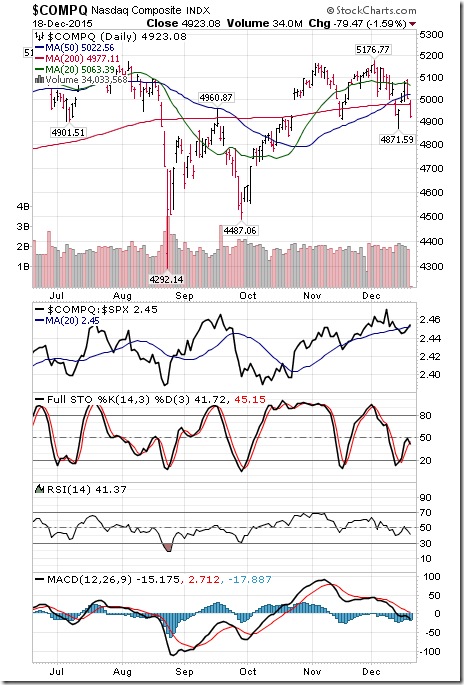
Bullish Percent Index for NASDAQ Composite stocks slipped last week to 46.42% from 47.11% and remained below its 20 day moving average. The Index continues to trend down.
The NASDAQ Composite Index dropped 10.38 points (0.21%) last week. Intermediate trend changed to neutral from up on a move below 4,908.66. Strength relative to the S&P 500 Index changed to Neutral from Positive. The Index remains below its 20 day moving average. Short term momentum indicators are mixed. Technical score slipped last week to -1 from 2.
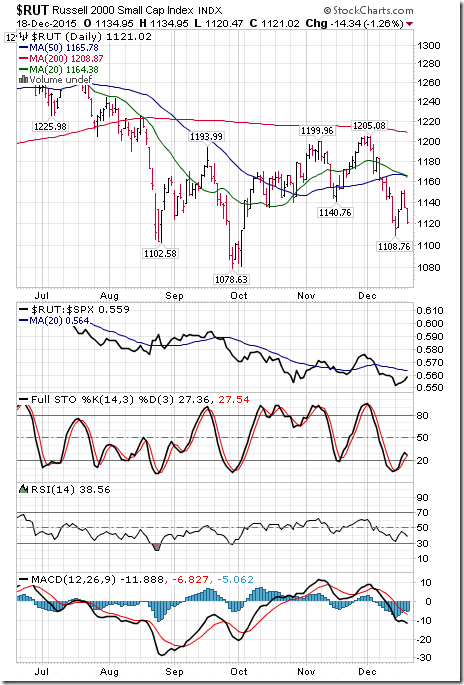
The Russell 2000 Index lost 2.59 points (0.23%) last week. Intermediate trend remains Neutral. Strength relative to the S&P 500 Index changed to Negative from Neutral. The Index remains below its 20 day moving average. Short term momentum indicators have turned higher. Technical score remained at -2.
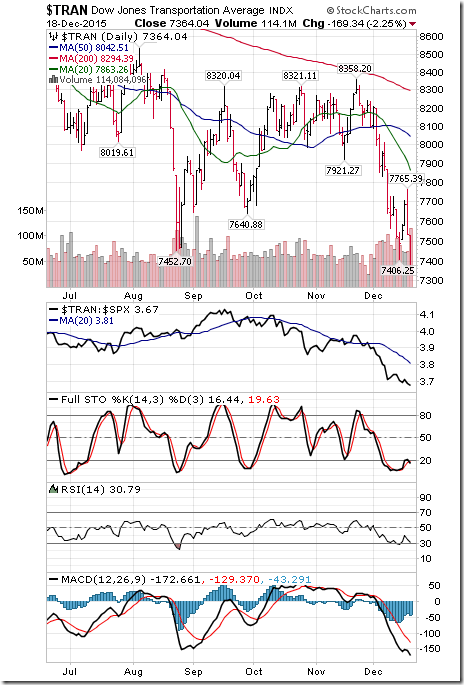
The Dow Jones Transportation Average plunged 160.60 points (2.13%) last week. Intermediate trend remains down. Strength relative to the S&P 500 Index remains negative. The Average remains below its 20 day moving average. Short term momentum indicators are trending down. Technical score remained at -6.
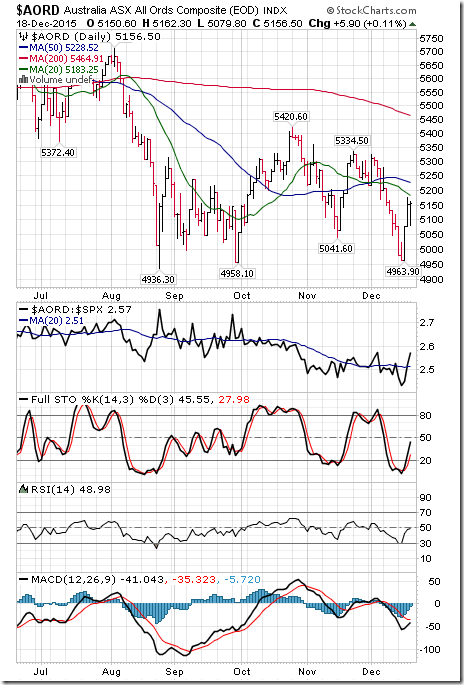
The Australia All Ordinaries Composite Index added 77.90 points (1.53%) last week. Intermediate trend changed to down from up on a move below 5,041.60. Strength relative to the S&P 500 Index changed to Positive from Neutral. The Index remains below its 20 day moving average. Short term momentum indicators are trending up. Technical score remained last week at 0.
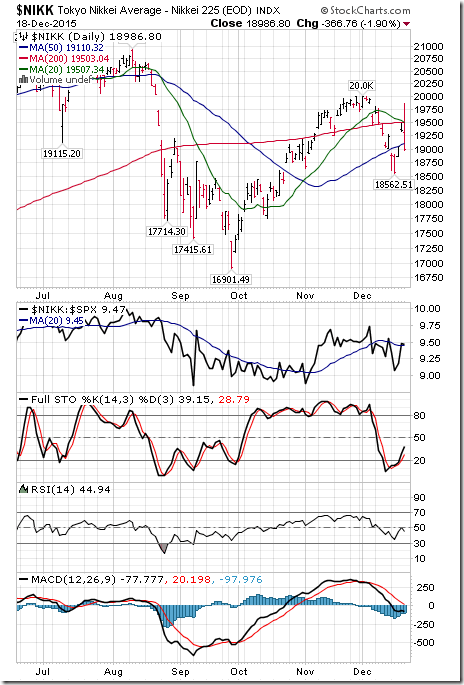
The Nikkei Average dropped 243.68 points (1.27%) last week. Intermediate trend remains Neutral. Strength relative to the S&P 500 Index remained Neutral. The Average remained below its 20 day moving average. Short term momentum indicators are trending up. Technical score improved last week to 0 from -2.
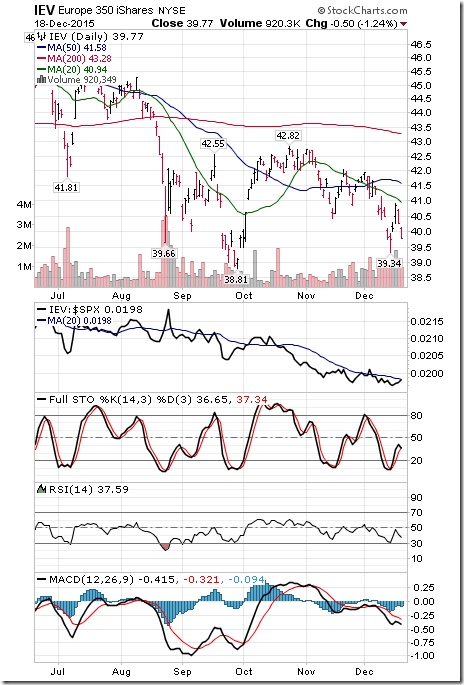
Europe 350 iShares slipped $0.04 (0.10%) last week. Intermediate trend remains down. Strength relative to the S&P 500 Index remains negative. Units remain below their 20 day moving average. Short term momentum indicators are mixed. Technical score last week slipped to -5 from -4.
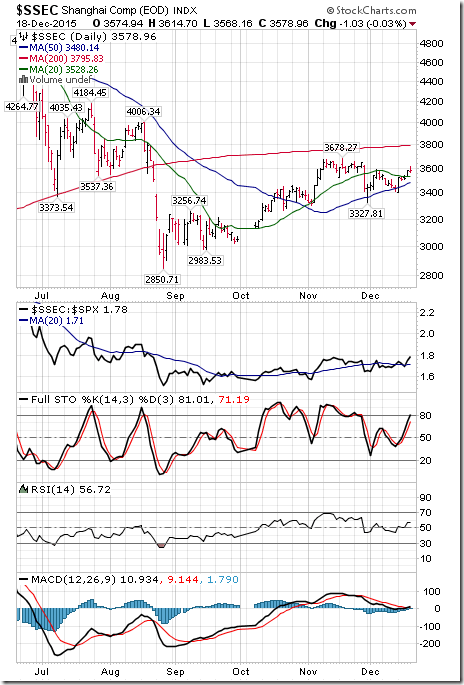
The Shanghai Composite Index added 144.38 points (4.20%) last week. Intermediate trend remains up. Strength relative to the S&P 500 Index turned positive from neutral. The Index moved above its 20 day moving average. Short term momentum indicators are trending up. Technical score improved last week to 6 from 0.
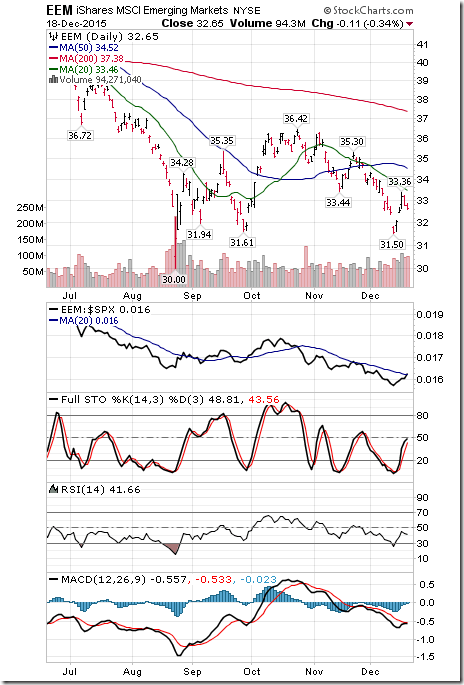
Emerging Markets iShares added $1.10 (3.49%) last week. Intermediate trend remains down. Strength relative to the S&P 500 Index improved to Neutral from Negative. Units remain below their 20 day moving average. Short term momentum indicators are trending up. Technical score improved last week to -2 from -6.
Currencies
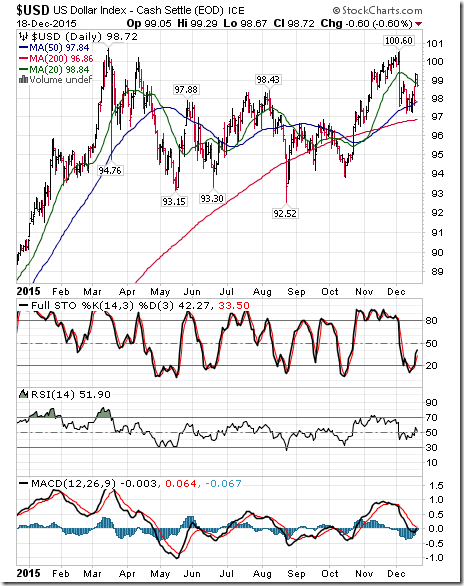
The U.S. Dollar Index added 1.15 (1.18%) last week. Intermediate trend remains up. The Index returned to below its 20 day moving average on Friday. Short term momentum indicators are mixed.
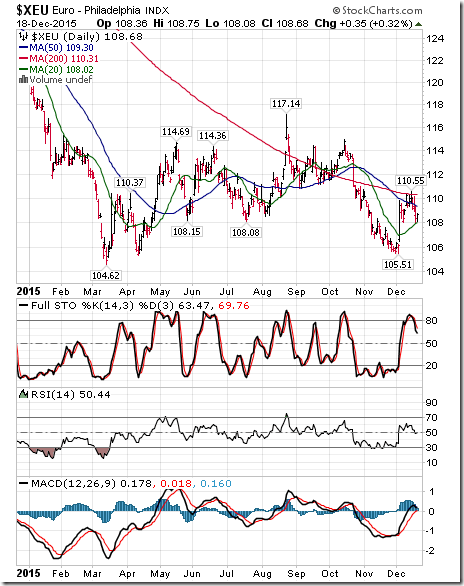
The Euro dropped 1.17 (1.07%) last week. Intermediate trend remains down. The Euro remains above its 20 day moving average. Short term momentum indicators are trending down.
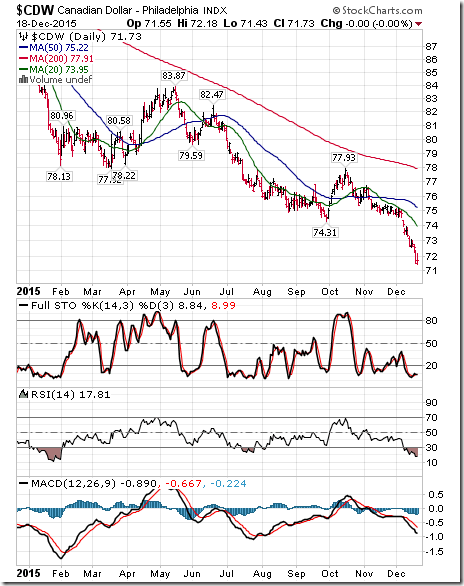
The Canadian Dollar plunged US 1.07 cents (1.47%) to reach an 11 year low. Intermediate trend remains down. The Canuck Buck remains below its 20 day moving average. Short term momentum indicators are trending down and are deeply oversold.
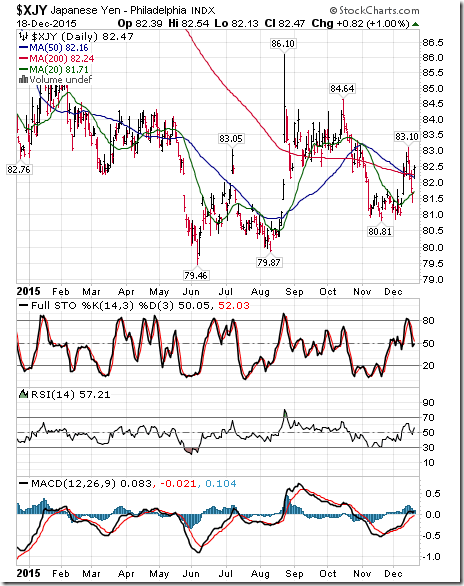
The Japanese Yen slipped 0.25 (0.30%) last week. Intermediate trend remains down. The Yen remains above its 20 day moving average. Short term momentum indicators are mixed.
Commodities
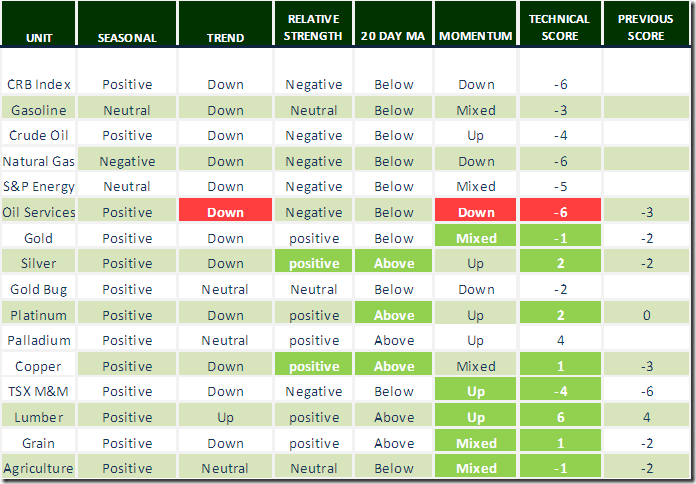
Daily Seasonal/Technical Commodities Trends for December 18th 2015
Green: Increase from previous day
Red: Decrease from previous day
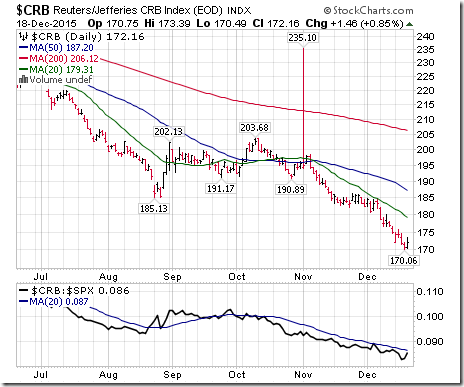
The CRB Index dropped another 2.70 points (1.54%) last week. Intermediate trend remains down. Strength relative to the S&P 500 Index remains Negative. The Index remains below its 20 day moving average. Short term momentum indicators are trending down. Technical score remains at -6.
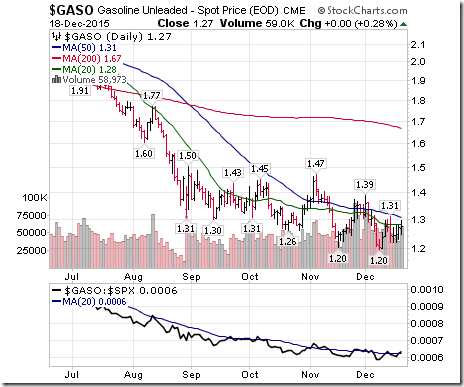
Gasoline slipped $0.01 per gallon (0.78%) last week. Intermediate trend remains down. Strength relative to the S&P 500 Index remains neutral. Gas slipped below its 20 day moving average. Short term momentum indicators are mixed. Technical score slipped last week to -3 from -1
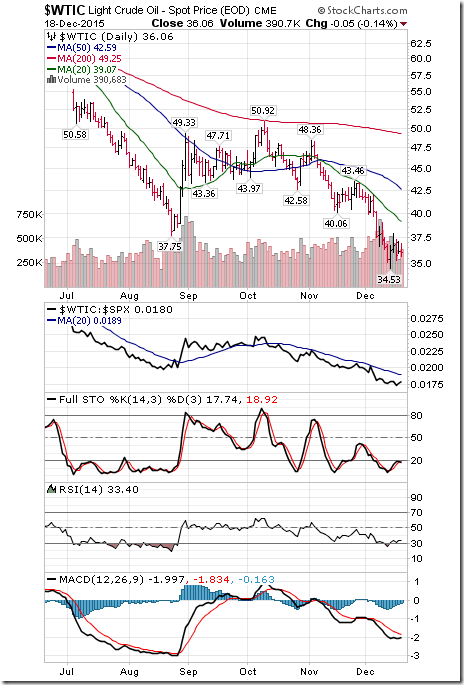
Crude Oil added $0.44 per barrel (1.24%) last week. Intermediate trend remains down. Strength relative to the S&P 500 Index remains negative. Crude remains below its 20 day moving average. Short term momentum indicators are trending up. Technical score improved to -4 from -6.
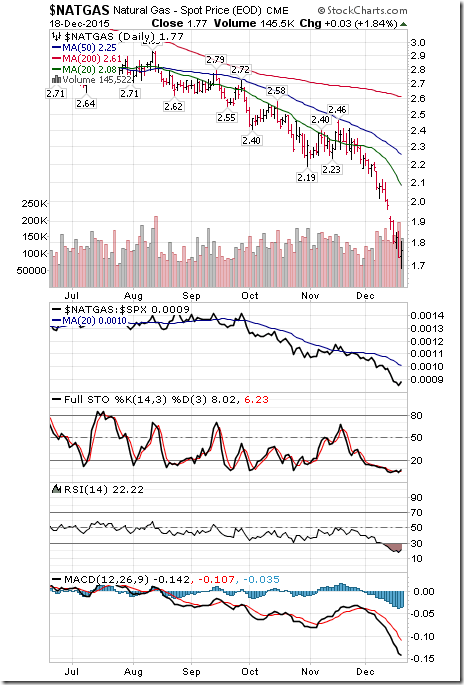
Natural Gas plunged $0.22 per MBtu (10.06%) last week. Intermediate trend remains down. Strength relative to the S&P 500 Index remains negative. “Natty” remains below its 20 day moving average. Short term momentum indicators are trending down and are deeply oversold. Technical score remained at -6
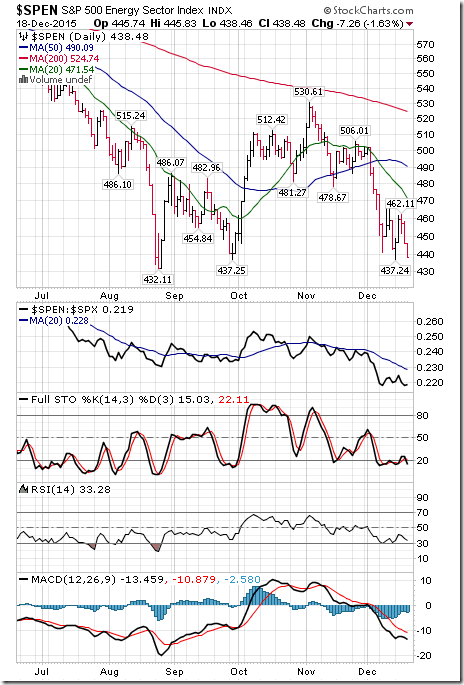
The S&P Energy Index dropped 4.68 points (1.06%) last week. Intermediate trend remains down. Strength relative to the S&P 500 Index remains negative. The Index remains below its 20 day moving average. Short term momentum indicators are mixed. Technical score remained at -5
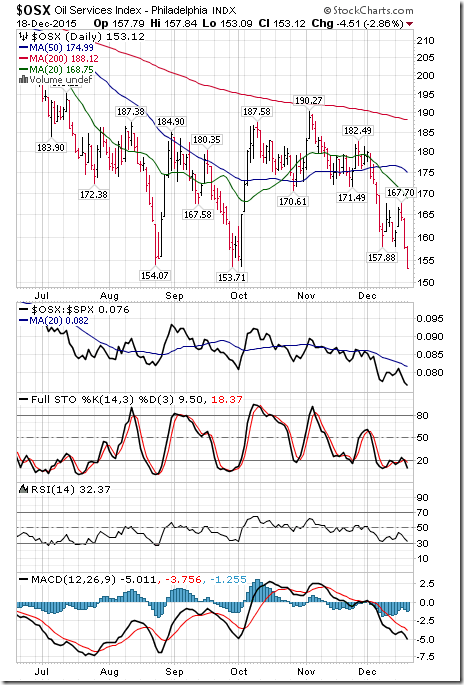
The Philadelphia Oil Services Index dropped 6.57 points (4.11%) last week. Intermediate trend changed to Down from Neutral on a move below 153.71 on Friday. Strength relative to the S&P 500 Index remains Negative. The Index remains below its 20 day moving average. Short term momentum indicators are trending down. Technical score dropped last week to -6 from -3.
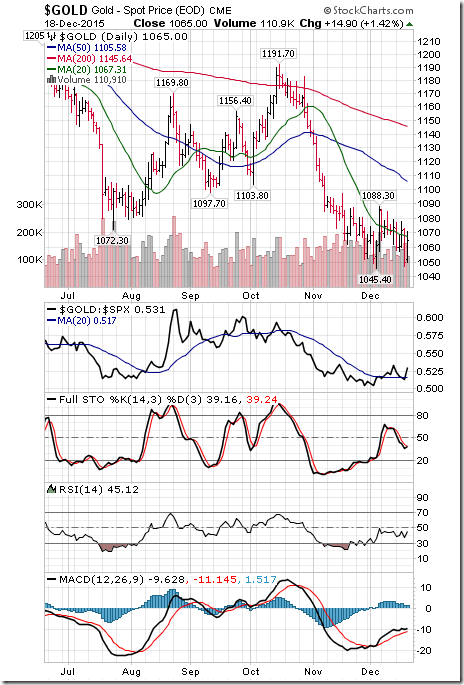
Gold dropped $10.70 per ounce (1.00%) last week. Intermediate trend remains down. Strength relative to the S&P 500 Index remains Positive. Gold moved below its 20 day moving average. Short term momentum indicators are mixed. Technical score slipped last week to -1 from 2.
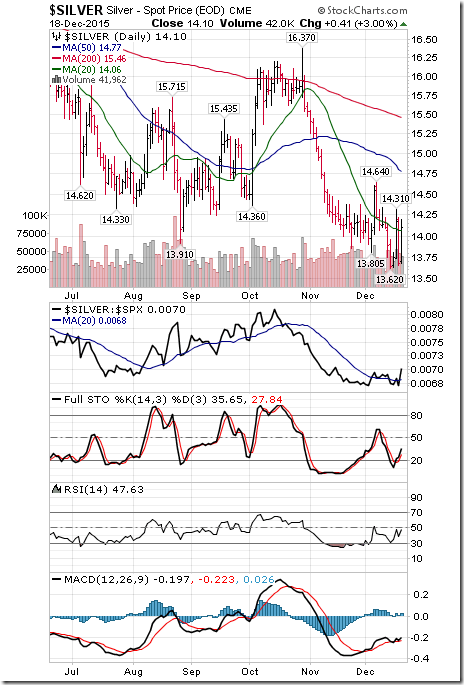
Silver added $0.22 per ounce (1.59%) last week. Intermediate trend remains down. Strength relative to the S&P 500 Index turned Positive from Neutral on Friday. Silver moved above its 20 day moving average on Friday. Short term momentum indicators are trending up. Technical score improved last week to 2 from -4. Strength relative to Gold was Neutral.
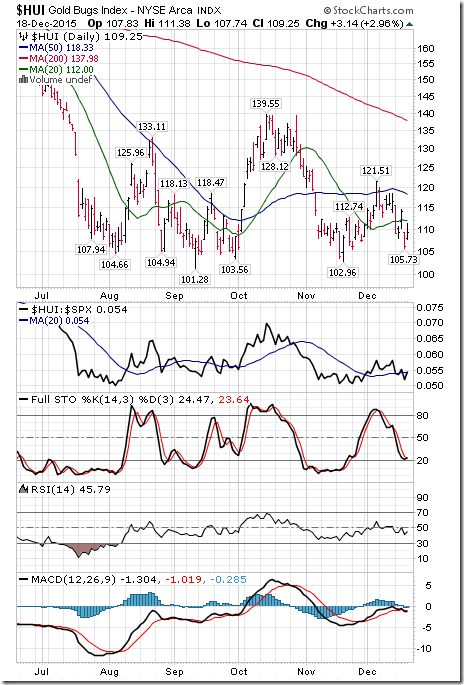
The AMEX Gold Bug Index dropped 7.24 points (6.22%) last week. Intermediate trend remains Neutral. Strength relative to the S&P 500 Index changed to Neutral from Positive. The Index remains below its 20 day moving average. Short term momentum indicators are trending down. Technical score dropped last week to 0 from 4. Strength relative to Gold was Neutral.
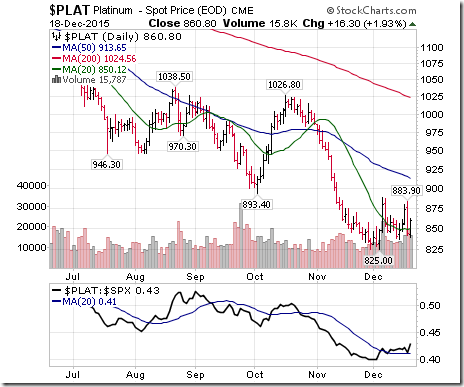
Platinum gained $17.10 per ounce (2.03%) last week. Trend remains down. Relative strength turned positive. PLAT moved above its 20 day moving average on Friday.
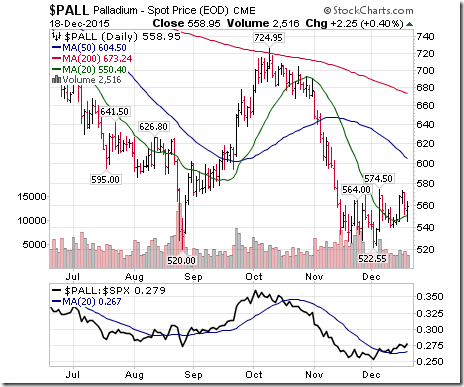
Palladium gained $14.15 per ounce (2.60%) last week. Strength relative to the S&P 500 Index turned positive. PALL moved above its 20 day moving average. Short term momentum indicators are trending up. Strength relative to Gold turned Positive.
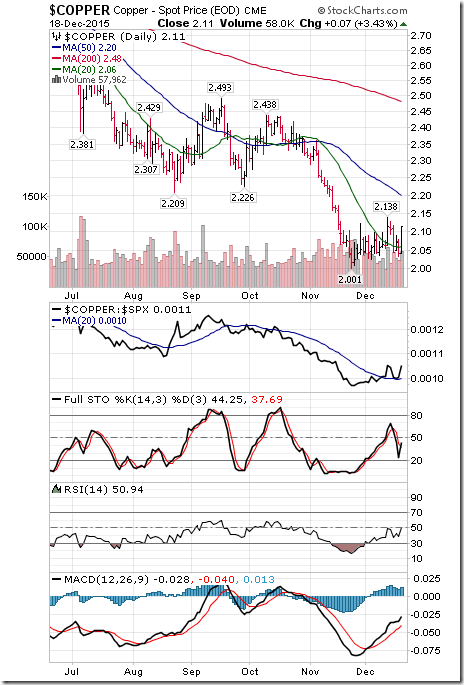
Copper slipped $0.01 per lb. (0.47%) last week. Intermediate trend remains down. Strength relative to the S&P 500 Index remains Positive. Copper moved above its 20 day moving average on Friday. Short term momentum indicators are mixed. Technical score slipped last week to 1 from 2.
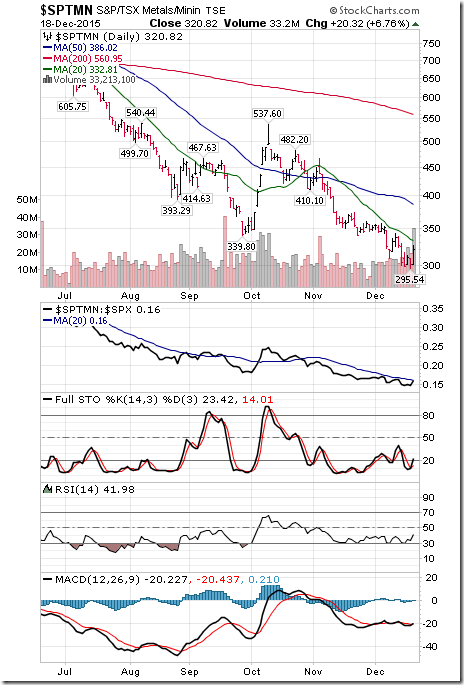
The S&P/TSX Metals & Mining Index dropped 4.79 points (1.47%) last week. Intermediate trend remains down. Strength relative to the S&P 500 Index remains negative. The Index remains below its 20 day moving average. Short term momentum indicators turned Positive from Negative on Friday. Technical score slipped last week to -4 from -2.
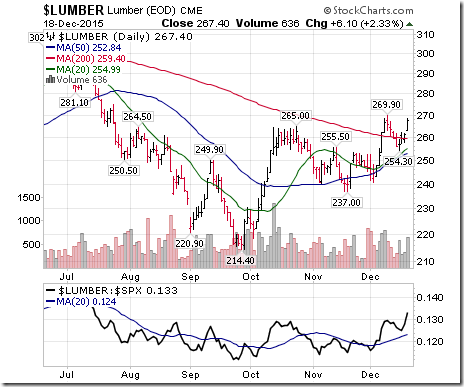
Lumber gained $6.60 (2.53%) last week. Intermediate trend remains up. Strength relative to the S&P 500 Index remains positive. Momentum indicators are trending up.
Technical score: 6
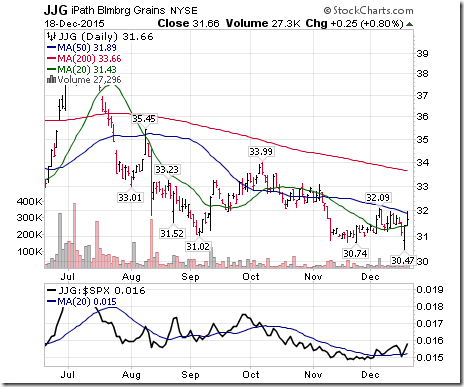
The Grain ETN added $0.14 (0.44%) last. Trend remains down. Relative strength remained positive. Units moved above their 20 day moving average. Short term momentum indicators are mixed. Technical score slipped last week to 1 from 2.
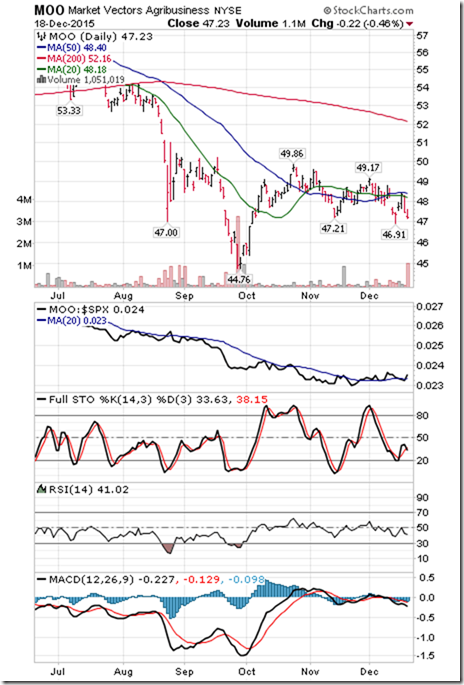
The Agriculture ETF dropped $1.20 (2.47%) last week. Intermediate trend remains Neutral. Strength relative to the S&P 500 Index changed to Neutral from Positive. Units remain below their 20 day moving average. Short term momentum indicators are mixed. Technical score dipped last week to -1 from 0.
Interest Rates
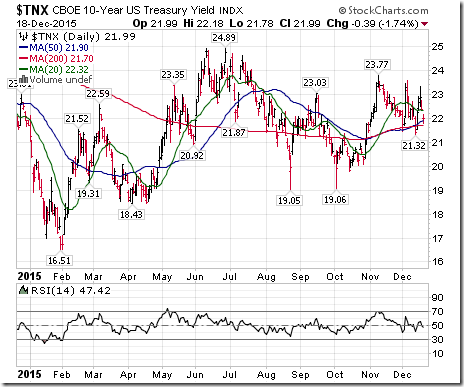
Yield on 10 year Treasuries added 6 basis points (2.81%) last week. Intermediate trend remains up. Yield remains below its 20 day moving average. Short term momentum indicators are trending down.
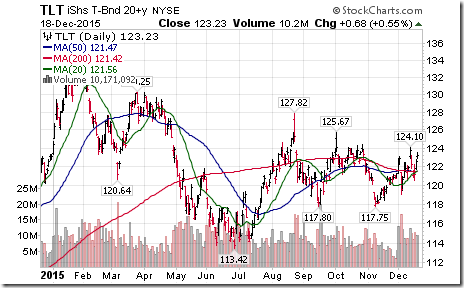
Conversely, price of the long term Treasury ETF slipped $0.53 (0.43%) last week. Units remain above their 20 day moving average.
Other Issues
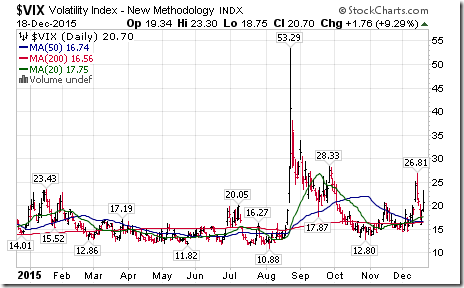
The VIX Index dropped 3.58 (14.74%) last week. Intermediate trend remains up. The Index remains above its 20 day moving average.
Technical action by S&P 500 stocks was mixed last week. 44 stocks broke support and 30 stocks broke resistance. Notable on the list of stocks breaking support were Consumer Discretionary stocks. Notable on the list of stocks breaking resistance were utility stocks.
Economic data this week is expected to have a neutral impact on equity markets
Earnings news this week is quiet. The focus is on Micron and Nike.
The proverbial Santa Claus rally from December 15th to January 6th has appeared. Most North American equity indices (exception: DJIA) likely reached a low on December 14th.
The El Nino effect on equity markets is expected to be positive until at least the end of February.
Consensus from FactSet shows that fourth quarter earnings per share by S&P 500 companies on a year-over-year basis will fall 4.5%, up from 4.4% last week. Fourth quarter revenues are expected to decline 3.1%, up 2.9% last week. 83 S&P 500 companies have issued negative earnings guidance for the fourth quarter, up from 84 companies last week while 26 companies have issued positive guidance. Prospects beyond the fourth quarter turn positive when the negative impact of a strong U.S. Dollar Index will have less influence. Year-over-year earnings per share are expected to increase 1.5% in the first quarter, down from 1.7% last week and 7.7% for 2016, down from 7.9% last week. Year-over-year revenues are expected to increase 2.7% in the first quarter, down from 2.9% last week and 4.3% for 2016, down from 4.4% last week. Question: When will investors begin to anticipate gains by earnings and revenues following their current downtrend? Probably when difficult fourth quarter reports are released in late January accompanied by positive guidance! Stay tuned!
Volumes on equity markets are expected to diminish as the Christmas holiday approaches.
Last official date for trading Canadian listed equities for tax purposes in 2015 is December 24th
Sectors
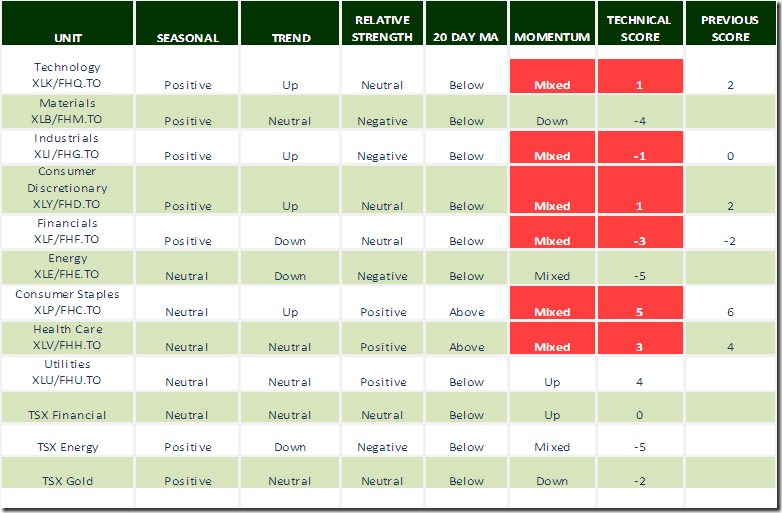
Daily Seasonal/Technical Sector Trends for December 18th 2015
Green: Increase from previous day
Red: Decrease from previous day
StockTwits Released on Friday @EquityClock
Technical action by S&P 500 stocks to 10:15 AM: Bearish. Breakouts: $AET, $RHT, $TSS. Breakdowns: $AZO, $KMX, $JBHT, $MAS, $ACN.
Editor’s Note: After 10:15 AM, Breakdowns included GPS, JWN, EXPD, AON, HST. No breakouts.
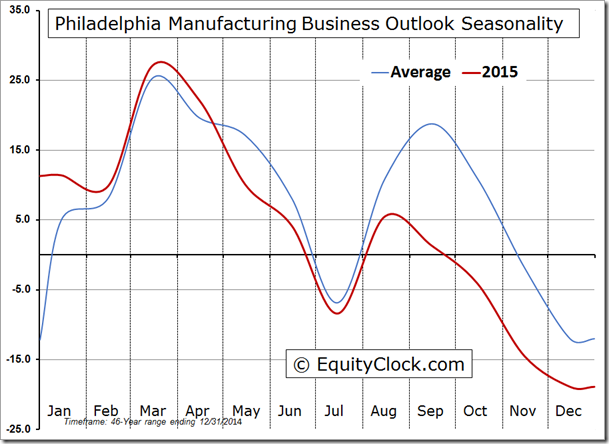
Philadelphia Manufacturing Business Outlook Survey closes the year firmly below average.
Special Free Services available through www.equityclock.com
Equityclock.com is offering free access to a data base showing seasonal studies on individual stocks and sectors. The data base holds seasonality studies on over 1000 big and moderate cap securities and indices. To login, simply go to http://www.equityclock.com/charts/ Following is an example:
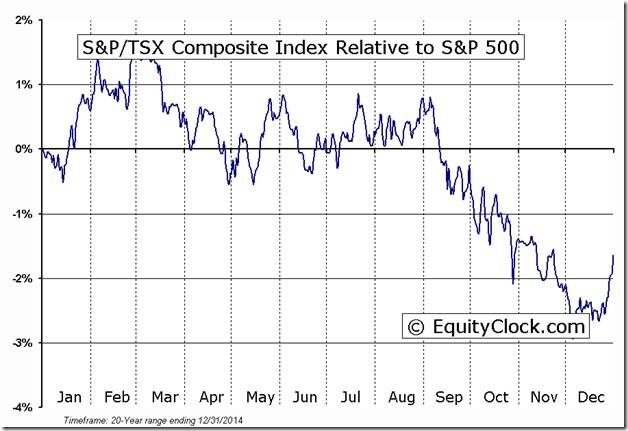
Editor’s Note: The period of seasonal strength for the TSX relative to the S&P 500 from mid-December to the end of February “clicked in” last week.
Disclaimer: Seasonality and technical ratings offered in this report by www.timingthemarket.ca and www.equityclock.com are for information only. They should not be considered as advice to purchase or to sell mentioned securities. Data offered in this report is believed to be accurate, but is not guaranteed.
Copyright © DV Tech Talk, Timingthemarket.ca


