Tech Talk for Friday December 18th 2015
by Don Vialoux, Timingthemarket.ca
Editor’s Note
Mr. Vialoux is scheduled to be the guest analyst on BNN’s Berman’s Call at 11:00 AM EST on Monday.
Interesting Charts
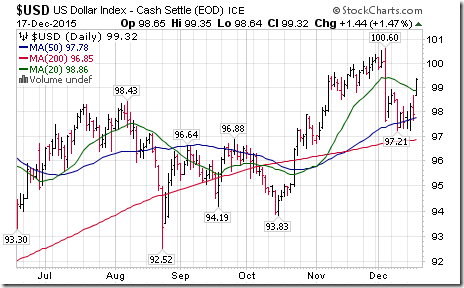
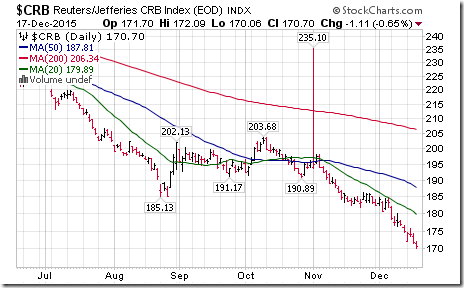
Strength in the U.S. Dollar triggered weakness in commodity prices and commodity sensitive equity prices yesterday.
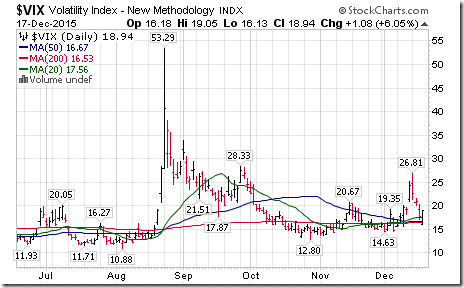
Weakness in commodity sensitive equities was a major reason for a spike in volatility.
Volatility and volume is expected to be higher than average today when equity markets experience Quadruple Witching (i.e. last trade day for December equity and index options and futures.
StockTwits Released Yesterday @equityclock
Industrial Production on pace to realized its first full year contraction since 2009. $STUDY #Economy
Technical action by S&P 500 stocks to 10:15: Quietly bullish. Breakouts: $AVP, $KEY, $PNC, $CAH, $CELG $DGX. No breakdowns.
Editor’s Note: After 10:15, Breakouts included SJM, PNW and SO while ROK broke support.
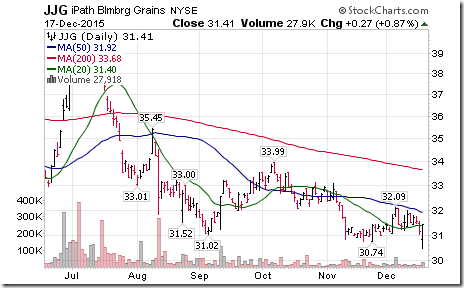
Grain prices remain under pressure. $JJG broke support at $30.74 to reach an all-time low. U.S. Dollar strength contributed to weakness in early trade.
Editor’s Note: Note the strong recovery near the close.
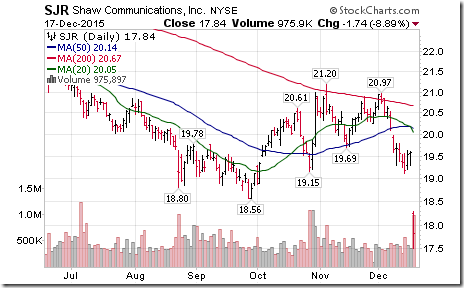
Shaw Communications $SJR $SJR.B. CA broke support to reach a 2 year low after purchasing Wind Mobile.
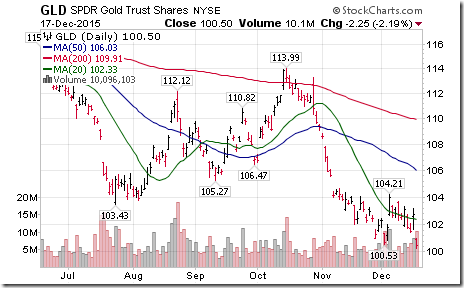
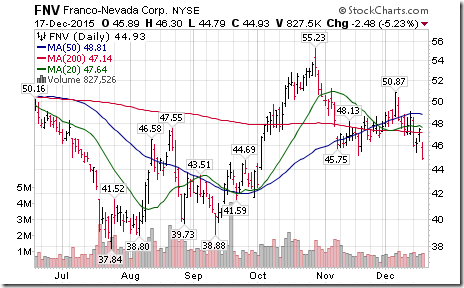
Gold ETF $GLD broke support at $100.53 to reach a 6 year low following strength in the U.S. Dollar Index
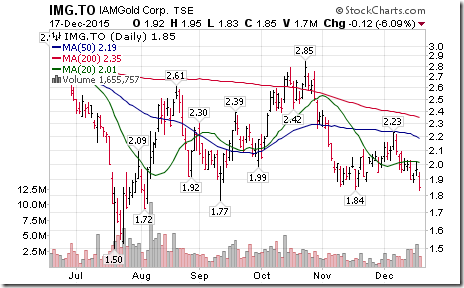
Editor’s Note: Selected gold stocks also broke support.
Trader’s Corner
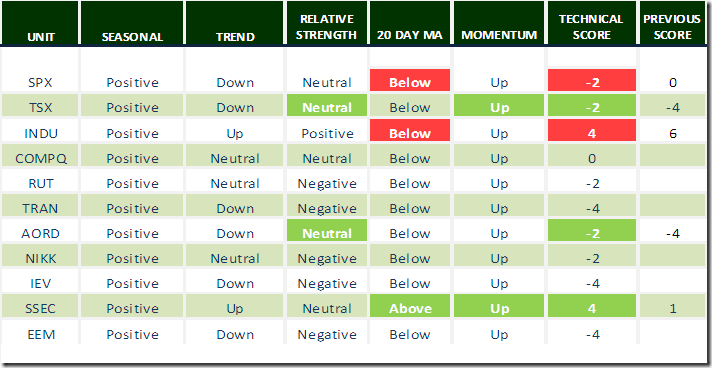
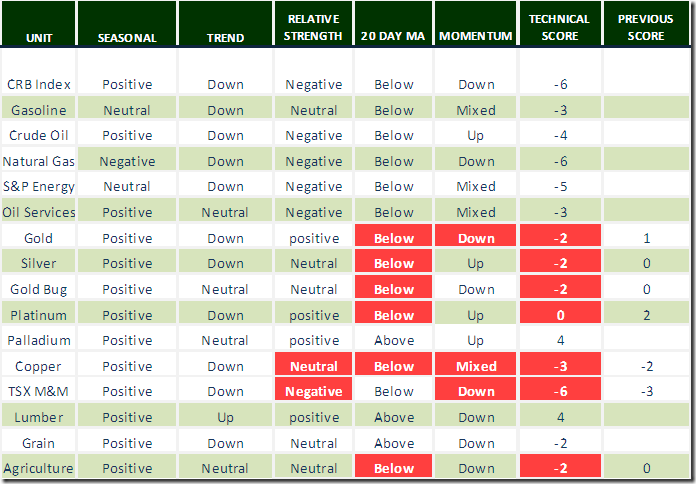
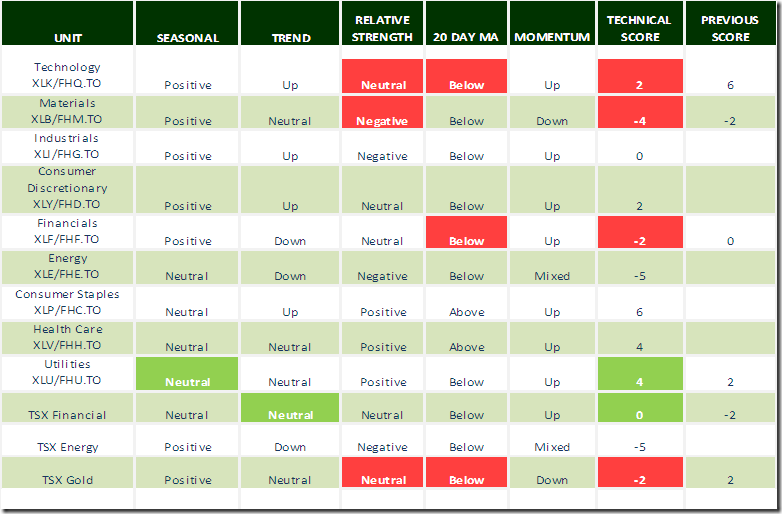
Technical scores generally declined mainly due to breaks below 20 day moving averages
Daily Seasonal/Technical Equity Trends for December 17th 2015
Green: Increase from previous day
Red: Decrease from previous day
Daily Seasonal/Technical Commodities Trends for December 17th 2015
Green: Increase from previous day
Red: Decrease from previous day
Daily Seasonal/Technical Sector Trends for December 17th 2015
Green: Increase from previous day
Red: Decrease from previous day
Special Free Services available through www.equityclock.com
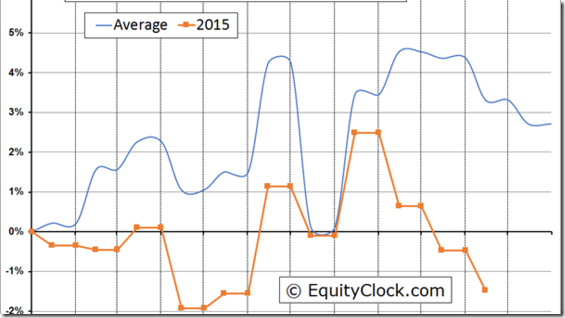
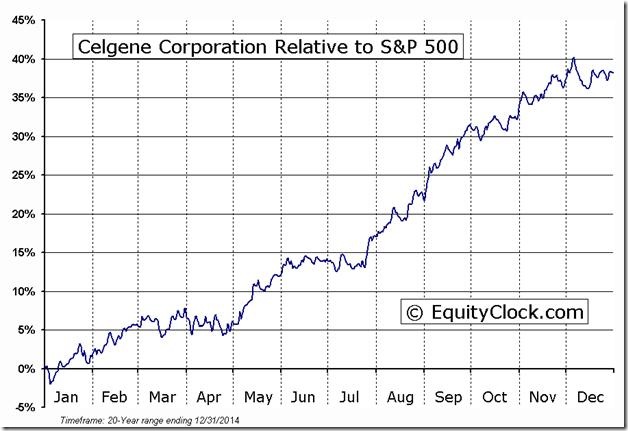
Equityclock.com is offering free access to a data base showing seasonal studies on individual stocks and sectors. The data base holds seasonality studies on over 1000 big and moderate cap securities and indices. To login, simply go to http://www.equityclock.com/charts/ Following is an example:
Disclaimer: Seasonality and technical ratings offered in this report by www.timingthemarket.ca and www.equityclock.com are for information only. They should not be considered as advice to purchase or to sell mentioned securities. Data offered in this report is believed to be accurate, but is not guaranteed.


