Two Large Canadian Sectors Leading the Way Down
For this week's SIA Equity Leaders Weekly, we are going to focus on the TSX Composite Index and where the strength and weakness is coming from within the index. Most recently, the index has been trading in a sideways trading range between 13,700 and 15,200. The strength of the Cdn market has come from non-resource sectors. We looked at where the strength has come from a few weeks ago and saw Consumer Staples and HealthCare has led the way up. This week let's look at Energy and Metals and Mining which have been leading the way down.
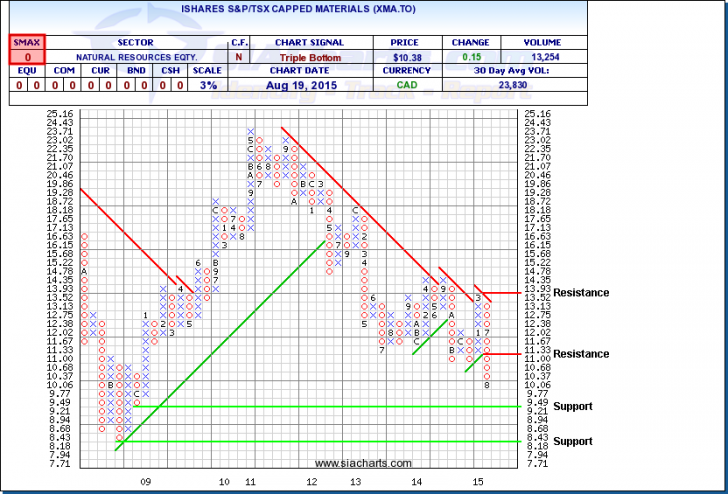
Ishares S&P/TSX Capped Materials (XMA.TO)
In looking at the chart of the Ishares S&P/TSX Capped Materials (XMA.TO) , we see that XMA.TO has continually made new lows with investors fleeing cyclical names which are extremely sensitive to global slowdowns and economic downturns. Support can now be found at $9.21 and, below that, $8.18 which would be the 2008/2009 low. Resistance can now be found at $11.33 and, above that, approx. $13.93. With an SMAX of 0 out of 10, XMA.TO is showing near term weakness against all asset classes.
Click on Image to Enlarge
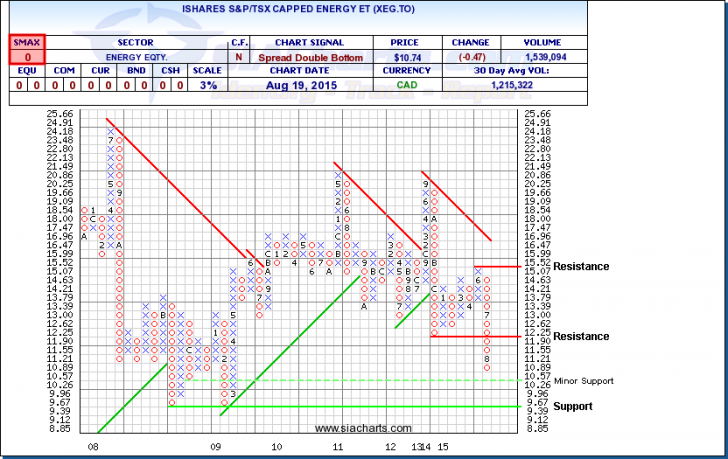
Ishares S&P/TSX Capped Energy (XEG.TO)
The Ishares S&P/TSX Capped Energy ETF (XEG.TO) has been in a steady downtrend due to weak commodity prices with Oil flirting at $40/barrel as we do not see any indication of OPEC supply cutbacks. As we look at the chart of the XEG.TO, we can see there is minor support at approximately the $10.26 level and we are quickly approaching the critical support level at $9.39 which is a level we have not seen since the 2008/2009 “Great Recession”. Resistance can be found at $12.25 and $15.52. With an SMAX of 0 out of 10, XEG.TO is showing near term weakness against all asset classes. If we continue to see more weakness in the Oil sector due to continued excess supply issues and a more prominent global slowdown overseas, suffice it to say Energy may continue to see more weakness and perhaps breach the $9.39 level on the way to a new low. In past Equity Leaders Weekly articles we have commented on staying away from Oil and other commodity related stocks. Nothing has changed with this outlook. We have always suggested staying with names exhibiting continued relative strength is a far safer way to go such as XST.TO which we had commented on a few weeks ago.
Click on Image to Enlarge
SIACharts.com specifically represents that it does not give investment advice or advocate the purchase or sale of any security or investment. None of the information contained in this website or document constitutes an offer to sell or the solicitation of an offer to buy any security or other investment or an offer to provide investment services of any kind. Neither SIACharts.com (FundCharts Inc.) nor its third party content providers shall be liable for any errors, inaccuracies or delays in content, or for any actions taken in reliance thereon.


