The comments below were provided by Kevin Lane of Fusion IQ.
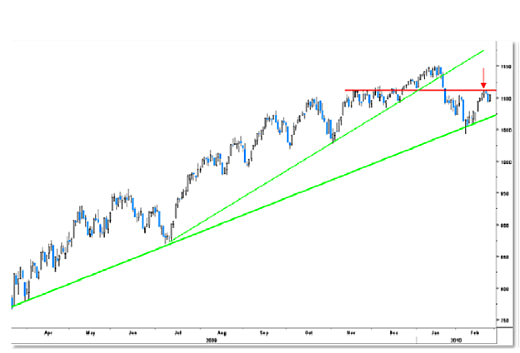
As seen from the chart below, the S&P 500 Index hit minor resistance a few trading sessions back near the 1,112 level (red line and red arrow). Until this level is taken out the near-term directional bias remains neutral.
Lower down, the key level to watch is in the 1,072 area (lower green line). This line represents a much more significant uptrend line and if violated would suggest a bigger correction.
Sentiment indicators are neutral at present, which is a positive, while market breadth remains a mixed bag.
Clearly the recent trading activity suggests volatility will be more present in day-to-day trading than over the past few months.

Source: Kevin Lane, Fusion IQ, February 25, 2010.


