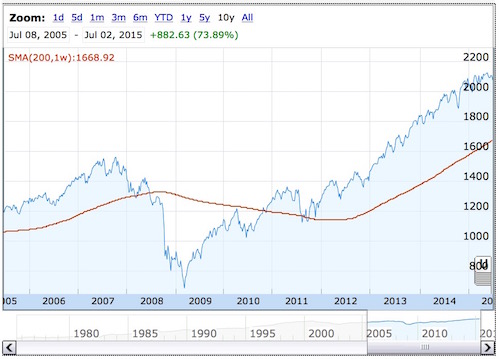
I offer analysis in this blog motivated by a reply to a tweet I made yesterday regarding the essence of the 200-day moving average. I show that the choice of a 200-day moving average for the purpose of stock-bond allocation is sub-optimal. Furthermore, any reduction in drawdown levels can be attributed to the asset allocation rather than to some particular choice of moving average.
This is the tweet I made yesterday and a reply from Jake:
@EconomPic But 200-ma is not the optimum. It is rather a random average for this job as I will show in a blog soon.
— Michael Harris (@mikeharrisNY) July 1, 2015
Let us investigate Jake’s claim. Basically Jake suggested this strategy:
If price of SPY > 200-dma then sell TLT and buy SPY
sell SPY if price of SPY < 200-dma and buy TLT.
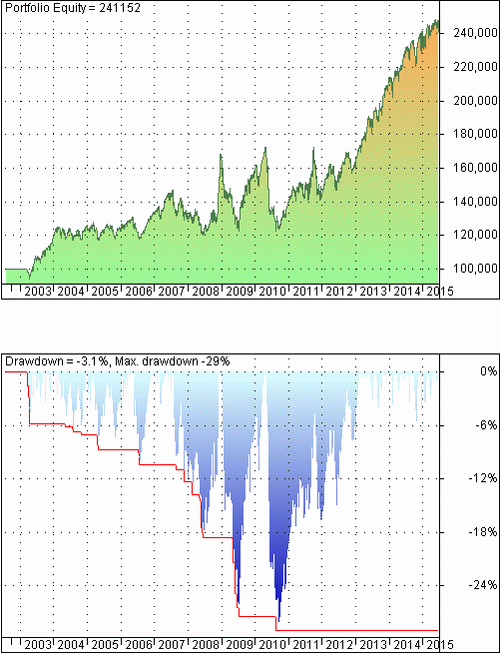
I used initial capital of $100K, fully invested equity and $0.01/share commission. The backtest starts at the inception date of TLT, which is 07/30/2002. Below is the portfolio equity and underwater equity curve:

Equity and drawdown for allocation based on a 200-day moving average. Charts created with AmiBroker – advanced charting and technical analysis software. http://www.amibroker.com
Maximum drawdown is about half of what is realized by a buy and hold strategy in SPY. Obviously, risk is reduced because a -29% maximum drawdown is much better than a maximum drawdown of -56% for the buy and hold case. The buy and hold CAR in the tested period for SPY is 8.81% and CAR for the allocation strategy is 7.05%, actually not too bad considering the 50% reduction in maximum drawdown.
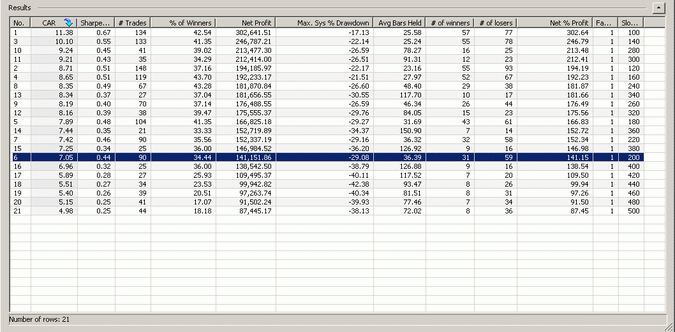
However, the objective of this blog is to show that the choice of the 200-day moving average is not special. To achieve that, I repeated the backtest for values of the moving average between 100 and 500 in increments of 20 days. Below are the results of the optimization:

Charts created with AmiBroker – advanced charting and technical analysis software. http://www.amibroker.com
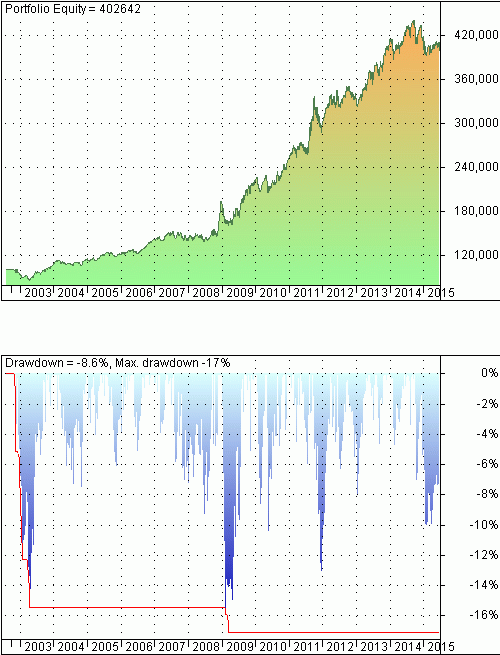
As it turns out the choice of a 200-day moving average is arbitrary and sub-optimal. A 100-day moving average results in the highest CAR of 11.38% at an even lower maximum drawdown of -17.13%. Below is the portfolio equity and underwater equity curve:

Equity and drawdown for allocation based on a 100-day moving average. Charts created with AmiBroker – advanced charting and technical analysis software. http://www.amibroker.com/
Therefore, I stand by my claim that the 200-day moving average was an invention of financial journalists that maybe later became a sort of (unsuccessful) self-fulfilling prophecy. In reality, the benefits of lower risk are inherent in the general allocation scheme and have little to do with the choice of moving average, except for values above 300 days where a large lag kicks in and drawdown levels increase.
Update:
@mikeharrisNY what about the same rule except with SPY 50-200? I suppose that can be tested as well with similar parameters.
— Ilya Kipnis (@QuantStratTradR) July 1, 2015
You can subscribe here to notifications of new posts by email.
Charting program: Amibroker
Disclaimer
Detailed technical and quantitative analysis of Dow-30 stocks and popular ETFs can be found in our Weekly Premium Report.
© 2015 Michael Harris. All Rights Reserved. We grant a revocable permission to create a hyperlink to this blog subject to certain terms and conditions. Any unauthorized copy, reproduction, distribution, publication, display, modification, or transmission of any part of this blog is strictly prohibited without prior written permission.
Copyright © Price Action Lab


