April 7, 2015: Market Minute: The Technical Outlook for Oil. Part 1
by Donald W. Dony, FCSI, MFTA, The Technical Speculator
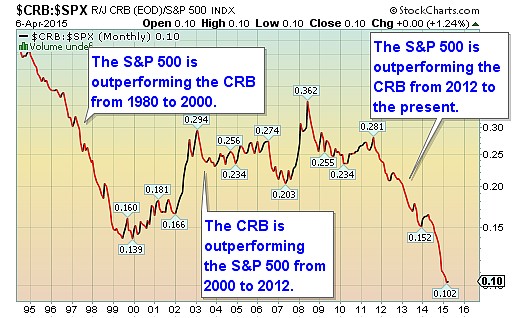
Commodities normally go through a multi-year phase of strength and performance against the benchmark S&P 500 and then an approximate equal period of time of underperformance to the U.S. index.
Each stage of this Commodity/Stock cycle, lasts on average about 18 years. This has been the pattern for over 100 years.
For example, in chart 1, from 1980 to 2000, the S&P 500 outperformed the Commodity Research Bureau Index (CRB). From 2000 to 2012, the CRB outperformed the S&P 500. And from 2012 to the present, the U.S. index is again, outperformed the CRB.
 The markets are now in this Stock (S&P 500) cycle.
Energy (crude oil, heating oil and natural gas) equals the largest single component of the CRB. In the 10th revision (2005) of the index, energy now equals approximately 39% of the CRB.
One of the main factors affecting the long-term movement in oil prices is the U.S. dollar.
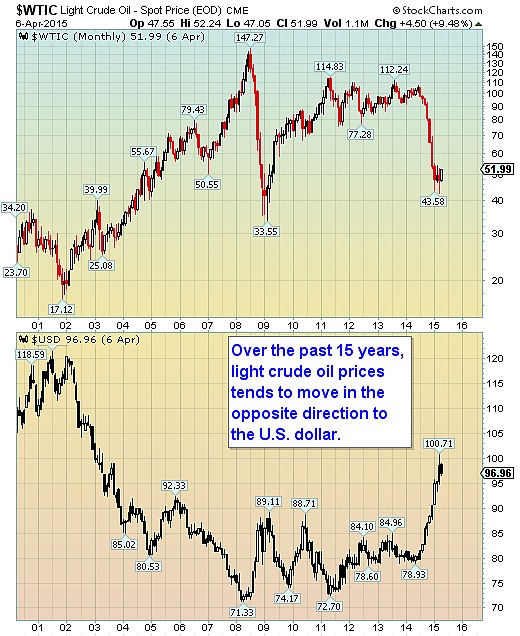
In chart 2, it shows that there is a moderate opposite corelation between WTI and the dollar. Over the past 15 years, when the trend of the $US is down, as in 2002 through 2009, oil prices have an upward tendency.
When the dollar bottoms and stabilizes (2009-2014), light crude oil prices no longer advance and "top-out".
And when the U.S. dollar rises (2014 to present), oil prices tend to decline.
One of the main characteristics of a Stock cycle, is strength in the U.S. dollar.
Fueled by stronger economic news than most other G10 countries, plus the eventual interest rate increase in the $US, the outlook for the dollar remains positive and is expected to a continue advance over the next few years with an eventual rise to $1.20.
Next week, part 2 of the Technical outlook for oil.
Donald W. Dony, FCSI, MFTA
Copyright © The Technical Speculator


