

This is sort of a followup to my last post; it's just another thought that came to mind as I was typing up a response to someone in the comment section, and I thought I'd expand the thought into a quick post as I think it's pretty important. (Blog readers take note: This is my Irving Fisher moment!)
Known Unknowns and Unknown Unknowns
Donald Rumsfeld said a long time ago:
There are known knowns. These are things we know that we know. There are known unknowns. That is to say, there are things that we know we don't know. But there are also unknown unknowns. There are things we don't know we don't know.
And also Howard Marks said, it's what you think you know that just ain't so that is going to kill you. Maybe this would go into Rumsfeld's "unknown, unknown".
But OK. Enough of that. Where am I going with this?
I think a lot of people get caught up with the fact that the stock market is way overvalued. Buffett (and Tepper and some others) has said many times that the market is not bubbled up and is in a zone of reasonableness.
Many people put up Shiller's CAPE chart to show how egregiously overvalued the stock market is. However, I have pointed out many times here that sometimes those macro, big picture charts can be very misleading. People look at charts like that and conclude that the market must go down. However, that is a total fallacy.
For example, for a very long time stock dividend yields were higher than bond yields because stocks were viewed as speculative.
Look at this chart:
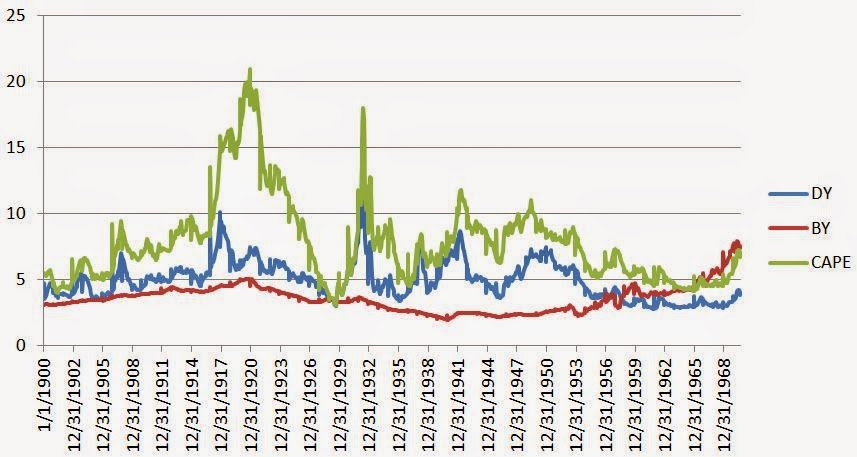
(data from Shiller's website: http://www.econ.yale.edu/~shiller/data.htm)
*for CAPE, I used the inverse so it can be compared to bond and dividend yields.
The data goes back to before 1900, but I couldn't convert the dates from before 1900 in Excel (I used to be good at spreadsheets, but now seem to have forgotten a lot! Or they changed too much.), so we will just deal with post 1900 data. It shouldn't really change anything. Oh, and I wasn't able to put the entire time series in one chart so I divided it up into two sections; 1900 - 1970 and 1970 - 2014.
As you notice, throughout history, dividend yields were higher (and often much higher) than bond yields. But this flipped over in the 1950's. This is around the time that Buffett started his partnership, and both his father and Benjamin Graham warned him against getting into the stock market.
I don't know if this yield flip had anything to do with it, but you can imagine all the pundits warning people against investing in speculative stocks with dividend yields lower than bond yields and therefore not compensating investors for the additional risk taken. Since the 1800's, dividend yields were always higher than bond yields.
Anyone who held that view would have been out of the market for the rest of the century, and only recently would have been able to get back in.
So, caution number one: The past can be a great guide in assessing the market, but clinging too much to one indicator, however effective and foolproof it looks historically, can be dangerous.
Dividend yield itself has been used for a long time as an indication of an overvalued market. I remember hearing as long ago as the early 1990's that dividend yields of 3% (or below 4%) is just way too low. When it went under 2%, it was ridiculous. Some said it should be more like 4-5%. Well, if you needed 4-5% dividend yields, you would have been out of the market (or short) since the early to mid-1980's.
This is the chart for 1970 - 2014:
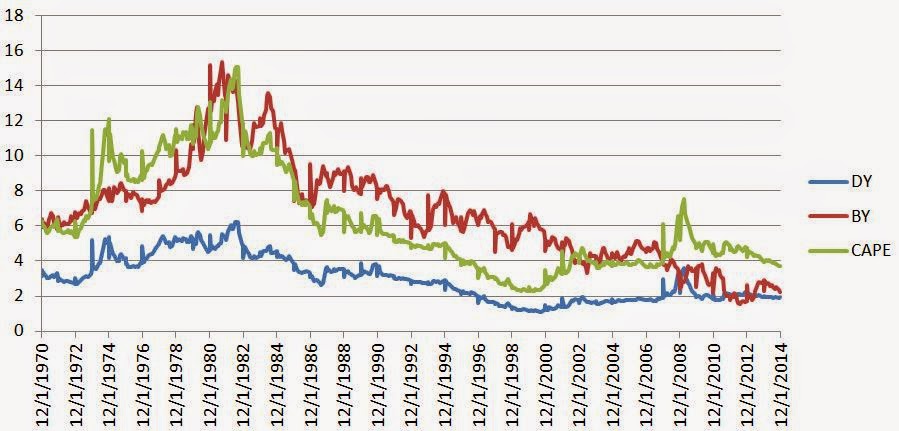
Now look at this. We keep hearing how CAPE is way out of bounds and we are going to have a serious correction. OK. Maybe.
But look really carefully here at the chart back in the late 1980's. One reason the stock market crashed in 1987 was because the stock and bond markets diverged. Look how the stock market earnings yield plunged lower as bond yields spiked. This discrepancy was corrected severely in a single day. Someone showed me an X-Y scatterplot of what happened (after the fact; I wasn't in the business back then) and how neatly earnings yield tracked bond yields and how they diverged in 1986 and 1987, and then how it snapped back.
Today, if you look at the chart we are in the opposite situation. Bond yields continue to plunge lower, but it seems like CAPE is sort of stuck where it was for much of the 2000's.
Of course, I would not go so far as to say that the market is undervalued and should actually be trading at a 50x p/e ratio.
But I don't see a need for an imminent, harsh correction either. Looking at the above chart, it just looks like the market is floating around in a range more or less similar to where it has been since the late 1980's.
Known Known
So, here's a known, known. We know that the market is not cheap, and maybe expensive on a historical basis by certain measures. But the only thing we can conclude for sure from that is that future returns from a higher price will lead to lower returns.
A guarantee of lower return does not mean that the market has to go down.
For example, I still remember when bond yields went under 6%. That was nuts to people who started in the business in the 1970's and 1980's. The U.S. government was constantly devaluing the dollar and overspending. There was no way that the hockey stick (deficit) can be stopped, so there is no way that a 6% bond yield was going to be sustainable. When it went under 5%, it was a joke.
If you were a bond investor back then, maybe 6% bond yields were not enough for you. Then you could have gotten out and stayed in cash. Would you have done better? Or maybe you could have been convinced the bond market had to collapse. So maybe you would have shorted the bond market. Or maybe you would have bought tons of puts against your long bonds. Either way, you would probably have gotten a lower return than the 6% (actually, way more than 6% due to the bond rally since then) that was way too low for you.
You can make the same argument at 5%, then 4%, 3% etc...
People have been calling the top of the bond market for as long as I can remember. (Japanese bond market too!).
So, caution number two: Just because something is high or low doesn't mean it has to reverse imminently. Some cycles are very, very long and can last for decades (bond bear market from 1940 to 1982, bull from 1982 and ongoing etc...)
Known Unknowns
Most of us have enough humility to admit that we really have no idea what will happen to the stock market, bond market, economy etc. But even then, many assume that due to the low interest rates (or high valuation), that bond prices must go down. Stock prices must go down.
Most admit that they don't know when it will go down, but they are convinced it will go down soon enough to make their decision to be short or stay out a good one (this is key!).
Unknown Uknowns
But to me, that's sort of the problem. People assume that just because bond yields are low, that they must necessarily go up. That stock prices are high, so they must necessarily go down. Yes, eventually they will. These things go up and down over time.
But if you really take a good, hard look at the charts above, those things can stay around this level for a long, long time.
Just as bond yields have been lower for a lot longer than anyone has ever expected, the CAPE can stay here for a long time too (as it does seem to follow bond yields to some extent).
If you are short the stock market (either by actually being short, or by having low exposure despite an equity mandate), you are simply betting on a rise in bond yields. So you are making a bet based on an economic forecast, basically.
What You Think You Know But Just Ain't So
So if you think the market must go down because it's expensive, maybe that just ain't so! Again, I go back to bonds. The bond market doesn't care if a bond investor is unhappy with a 3% yield or a 4% yield (Of course, there are some like Bill Gross that will call interest rates and make money).
Bears will argue that if you own stocks here, then you are basically betting that interest rates won't go up. Well, not necessarily. Buffett has been saying rates are way too low and that the bond market is the biggest bubble ever, but has been buying stocks pretty aggressively in recent years anyway.
Conclusion
So anyway, I just wanted to point out that just because bond yields are too low for your taste (stock market CAPE is too high), it doesn't necessarily follow that they must go UP (or CAPE go down). OK, so maybe they must go up eventually. But these cycles seem to be so long that it seems a bit silly to try to call the turn. (And no, that doesn't make me a perma-bull. Call me a perma-agnostic! The market will keep going up and down as it always has; there will be plenty of brutal bear markets to come regardless of all of this stuff).
The only thing we know for sure when rates are at 4% rather than 5% is that the returns will (most likely) be lower. At 2%, we can know for sure that returns will probably not be high. But we can't know for certain that rates will go up. And again, more specifically, we can't know for certain that it will go up soon enough for timers to benefit from it.
Copyright © The Brooklyn Investor