by Don Vialoux, EquityClock.com
Pre-opening Comments for Monday November 17th
U.S. equity index futures were lower this morning. S&P 500 futures were down 6 points in pre-opening trade. Index futures were responding to news that Japan’s economy declined in the third quarter. The Nikkei fell 2.95% last night.
Index futures were virtually unchanged following release of the November Empire Manufacturing Index. Consensus was an increase in the Index to 12.0 from 6.2 in October. Actual was a gain to 10.2.
Baker Hughes jumped $8.96 to $68.94 after Halliburton announced a deal to purchase the company for $34.6 billion. Per share value of the deal is estimated at $78.62 for each Baker Hughes share.
Allergan gained $8.85 to $207.50 on news that the company is near a buyout deal with Activis valued at $65 billion.
Procter & Gamble slipped $0.44 to $87.67after Canaccord downgraded the stock from Buy to Hold.
Boise Cascade (BCC $37.03) is expected to open lower after BMO Capital downgraded the stock from Outperform to Market Perform.
Starwood Hotels fell $0.16 to $78.50 after UBS downgraded the stock from Buy to Neutral.
TransOcean added $0.17 to $26.22 after Citigroup initiated coverage with a Buy rating. Target is $28.
EquityClock’s Daily Market Comment
Following is a link:
http://www.equityclock.com/2014/11/14/stock-market-outlook-for-november-17-2014/
Note comments on performance of the S&P 500 following November options expiry.
Mark Liebovit’s Comments on Gold and Silver
Following is a link:
Economic News This Week
November Empire Manufacturing Index to be released at 8:30 AM EST on Monday is expected to increase to 12.0 from 6.2 in October.
October Canadian Existing Home Sales to be released at 9:00 AM EST on Monday are expected to increase 6.0% year over year versus 10.6% year over year in September.
October Industrial Production to be released at 9:15 AM EST on Monday is expected to increase 0.2% versus a gain of 1.0% in September. October Capacity Utilization is expected to remain unchanged from September at 79.3%.
October Producer Prices to be released at 8:30 AM EST on Tuesday are expected to decline 0.1% versus a decline of 0.1% in September. Excluding food and energy, PPI is expected to increase 0.1% versus no change in September.
October Housing Starts to be released t 8:30 AM EST on Wednesday are expected to increase to 1,025,000 units from 1,017,000 units in September
FOMC meeting minutes for the October 29th meeting are to be released at 2:00 PM EST on Wednesday
Weekly Initial Claims to be released at 8:30 AM EST on Thursday are expected to slip to 285,000 from 290,000 last week.
October Consumer Prices to be released at 8:30 AM EST on Thursday are expected to decline 0.1% versus a gain of 0.1% in September. Excluding food and energy October CPI is expected to increase 0.2% versus a gain of 0.1% in September
November Philadelphia Fed Index to be released at 10:00 AM EST on Thursday is expected to slip to 18.5 from 20.7 in October.
October Existing Home Sales to be released at 10:00 AM EST on Thursday are expected to slip to 5.15 million units from 5.17 million units.
October Leading Economic Indicators to be released at 10:00 AM EST on Thursday are expected to increase 0.6% versus a gain of 0.8% in September
October Canadian Consumer Prices to be released at 8:30 AM EST on Friday are expected to fall 0.2% versus a gain of 0.1% in September. On a year-over-year basis, October CPI is expected to increase 2.0% versus 2.0% in September. October Core CPI is expected to increase 2.1% versus 2.1% in September.
Earnings News This Week
Summary of Weekly Seasonal/Technical Parameters for Equity Indices/ETFs
Seasonal: Positive, Negative or Neutral on a relative basis applying EquityClock.com charts
Trend: Up, Down or Neutral
Strength relative to the S&P 500 Index: Positive, Negative or Neutral
Momentum based on an average of Stochastics, RSI and MACD: Up, Down or Mixed
Green: Upgrade
Red: Downgrade
Equity Trends
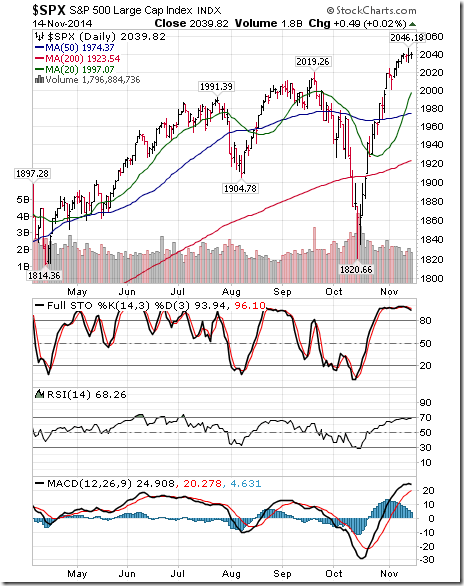
The S&P 500 Index added 0.39 points (0.39%) last week. Intermediate trend remains up. The Index remains above its 20, 50 and 200 day moving averages. Short term momentum indicators are trending up, but are overbought.
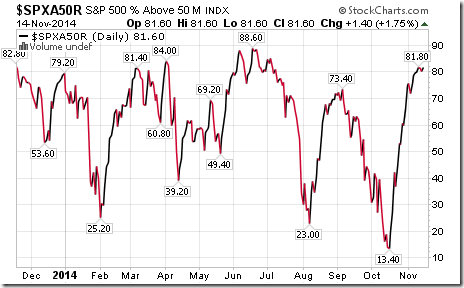
Percent of S&P 500 stocks trading above their 50 day moving average increased last week to 81.60% from 79.80%. Percent continues to trend up, but is intermediate overbought.
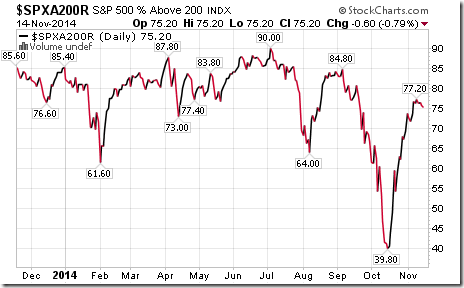
Percent of S&P 500 stocks trading above their 200 day moving average slipped last week to 75.20% from 76.20%. Percent is intermediate overbought and showing early signs of peaking.
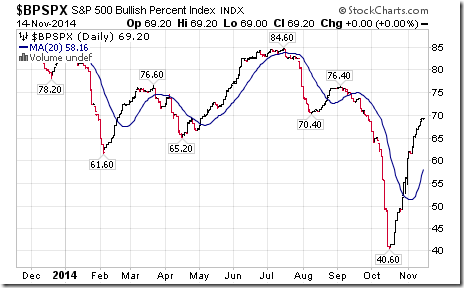
Bullish Percent Index for S&P 500 stocks increased last week to 69.20% from 65.80% and remained above their 20 day moving average. The Index continues to trend up, but is intermediate overbought.
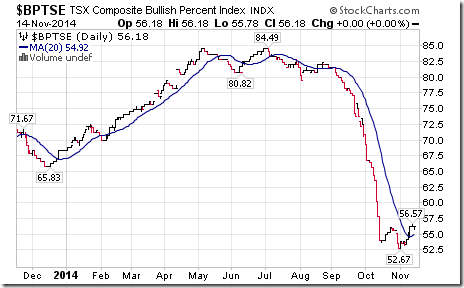
Bullish Percent Index for TSX Composite stocks increased last week to 56.18% from 54.18% and moved above its 20 day moving average.
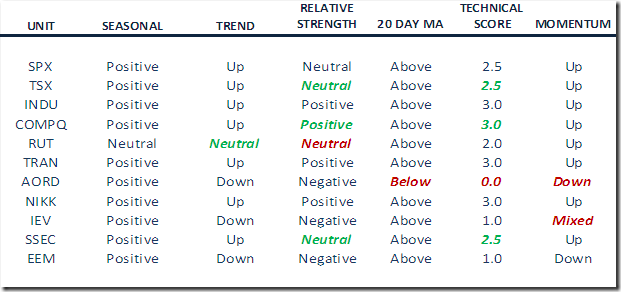
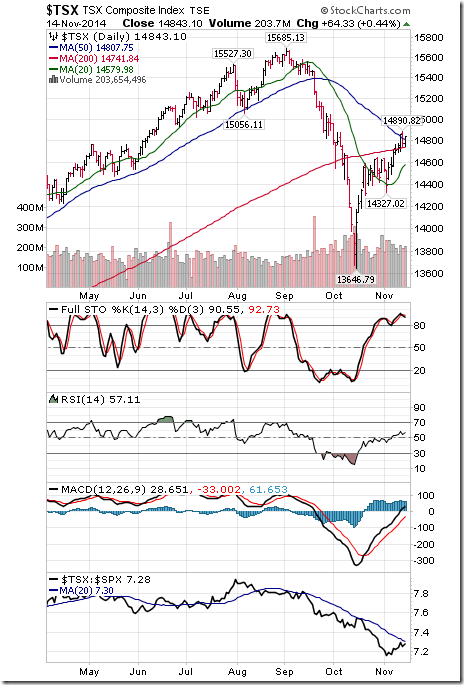
The TSX Composite Index gained 152.27 points (1.04%) last week. Intermediate trend remains up (Score: 1.0). The Index remains above its 20 day moving average (Score: 1.0). Strength relative to the S&P 500 Index changed to neutral from negative (Score: 0.5). Technical score improved to 2.5 from 2.0 out of 3.0. Short term momentum indicators are trending up.
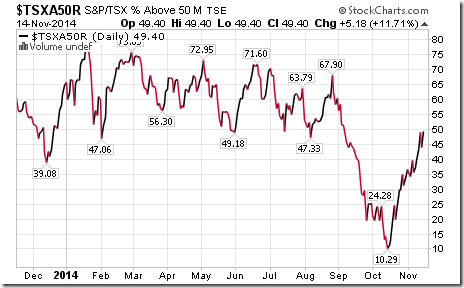
Percent of TSX stocks trading above their 50 day moving average increased last week to 49.40% from 37.45%. Percent remains in an intermediate uptrend.
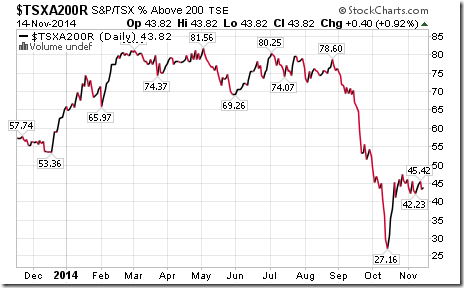
Percent of TSX stocks trading above their 200 day moving average increased last week to 43.82% from 42.23%.
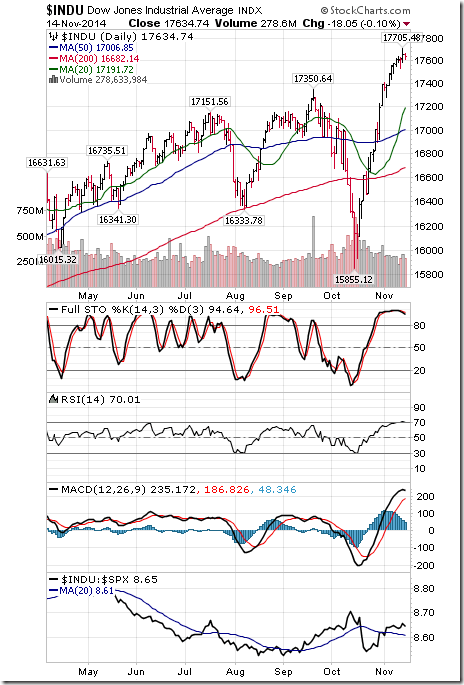
Dow Jones Industrial Average gained 60.81 points (0.35%) last week. Intermediate trend remains up. The Average remains above its 20 day moving average. Strength relative to the S&P 500 Index remains positive. Technical score remained at 3.0 out of 3.0. Short term momentum indicators are trending up, but are overbought.
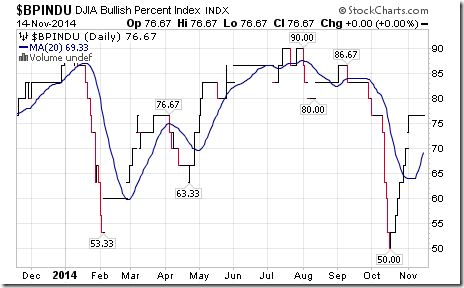
Bullish Percent Index for Dow Jones Industrial Average stocks was unchanged last week at 76.67% and remained above its 20 day moving average. The Index remains intermediate overbought.
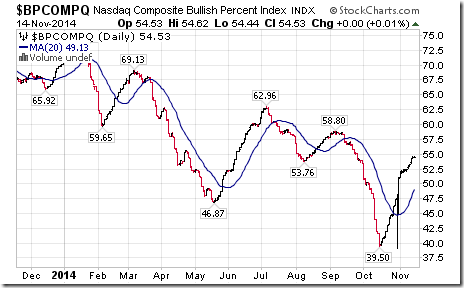
Bullish Percent Index for NASDAQ Composite stocks increased last week to 54.53% from 52.47% and remained above its 20 day moving average. The Index remains in an intermediate uptrend.
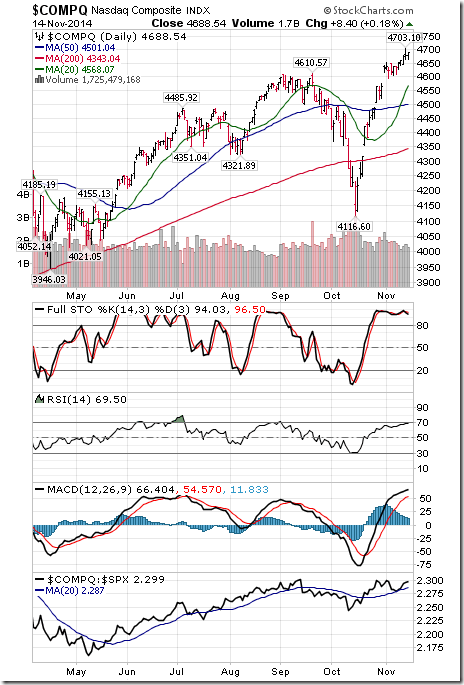
The NASDAQ Composite Index gained 56.01 points (1.21%) last week. Intermediate trend remains up. The Index remains above its 20 day moving average. Strength relative to the S&P 500 Index changed to positive from neutral. Technical score improved last week to 3.0 from 2.5. Short term momentum indicators are trending up, but are overbought.
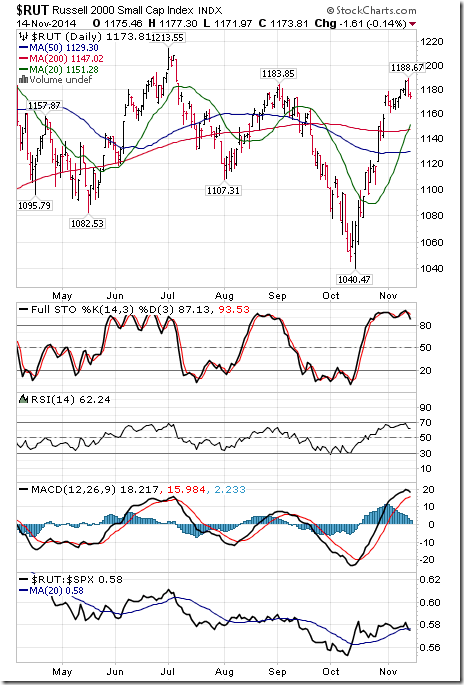
The Russell 2000 Index added 0.49 points (0.04%) last week. Intermediate trend changed to neutral from down on a move above 1,183.85. The Index remains above its 20 day moving average. Strength relative to the S&P 500 Index changed to neutral from positive. Technical score remained at 2.0. Short term momentum indicators are trending up, but are overbought and showing early signs of rolling over.
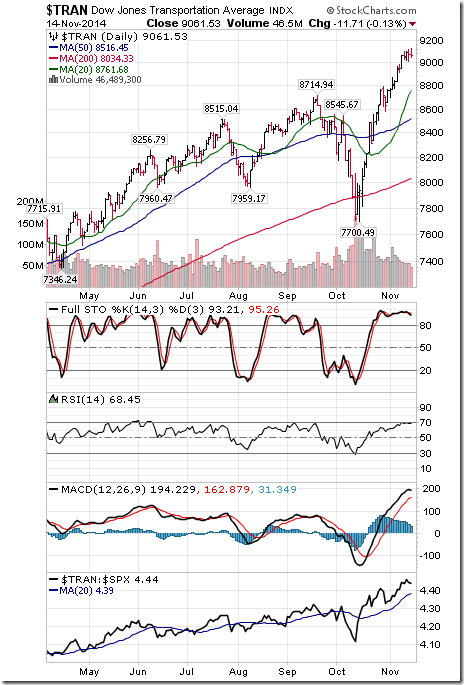
The Dow Jones Transportation Average added 112.72 points (1.26%) last week. Intermediate trend remains up. The Average remains above its 20 day moving average. Strength relative to the S&P 500 Index remains positive. Technical score remains at 3.0 out of 3.0. Short term momentum indicators are trending up, but are overbought.
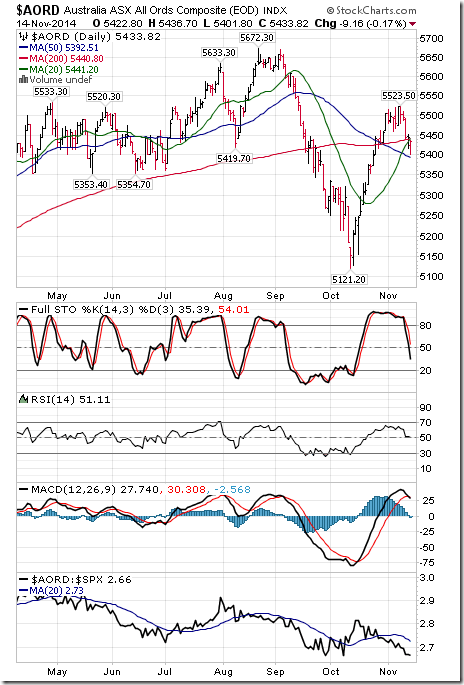
The Australia All Ordinaries Index fell 88.28 points (1.60%) last week. Intermediate trend remains down. The Index fell below its 20 day moving average on Friday. Strength relative to the S&P 500 Index remains negative. Technical score fell to 0.0 from 1.0 out of 3.0. Short term momentum indicators are trending down.
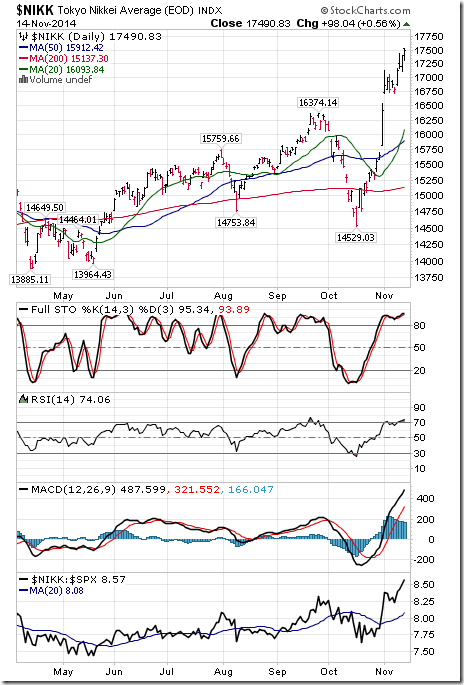
The Nikkei Average gained 610.45 points (3.62%) last week. Intermediate trend remains up. The Average remains above its 20 day moving average. Strength relative to the S&P 500 Index remains positive. Technical score remains at 3.0 out of 3.0. Short term momentum indicators are trending up, but are overbought.
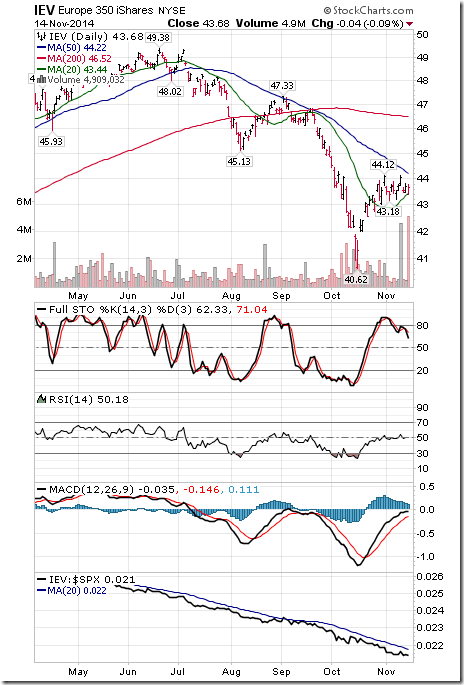
iShares Europe added $0.13 (0.30%) last week. Intermediate trend remains down. Units remain above their 20 day moving average. Strength relative to the S&P 500 Index remains negative. Technical score remains at 1.0 out of 3.0. Short term momentum indicators changed from up to mixed.
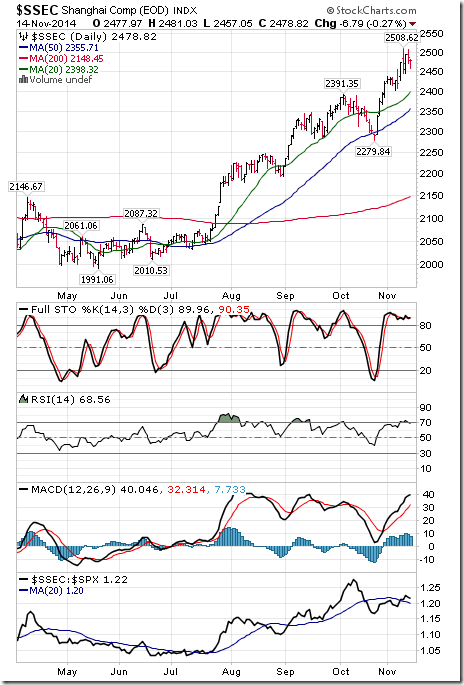
The Shanghai Composite Index gained 60.65 points (2.51%) last week. Intermediate trend remains up. The Index remains above its 20 day moving average. Strength relative to the S&P 500 Index changed to neutral from negative. Technical score improved to 2.5 from 2.0 out of 3.0 Short term momentum indicators are trending up, but are overbought.
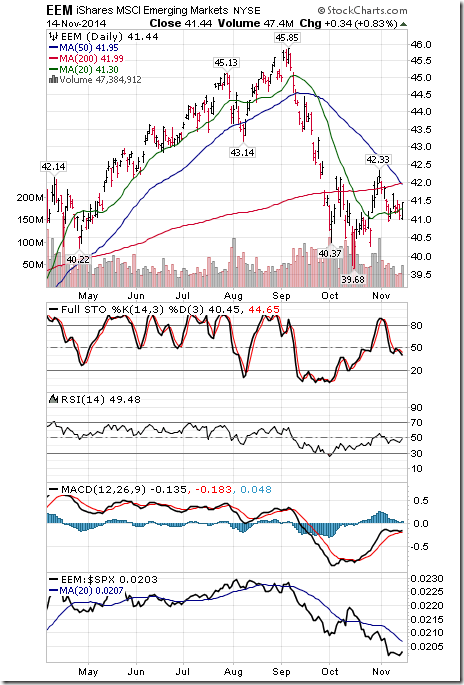
iShares Emerging Markets added $0.22 (0.53%) last week. Intermediate trend remains down. Units remain above their 20 day moving average. Strength relative to the S&P 500 Index remains negative. Technical score remains at 1.0 out of 3.0. Short term momentum indicators are trending down.
Currencies
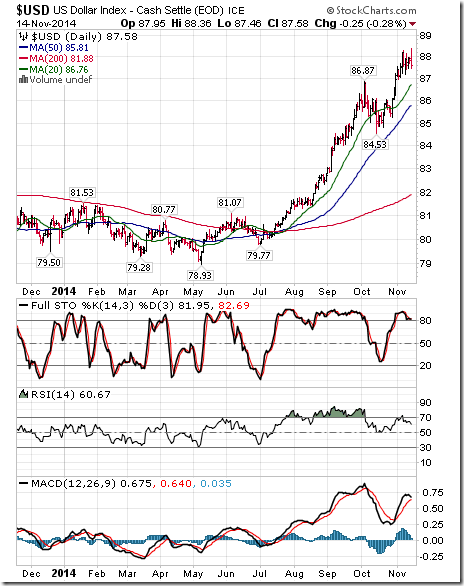
The U.S. Dollar Index slipped 0.05 (0.06%) last week. Intermediate trend remains up. The Index remains above its 20, 50 and 200 day moving averages. Short term momentum indicators are trending up, but are overbought and showing early signs of rolling over.
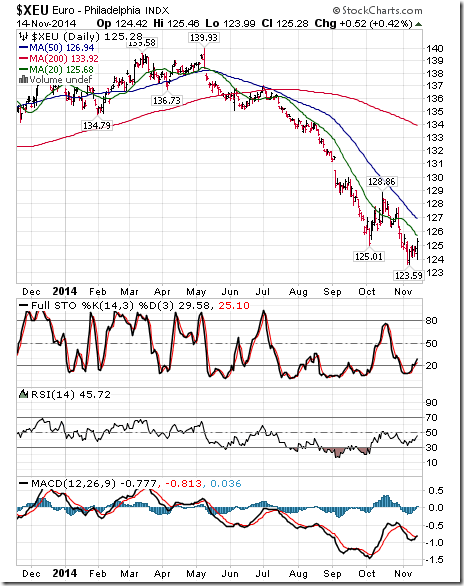
The Euro added 0.70 (0.56%) last week. Intermediate trend remains down. The Euro remains below its 20 day moving average. Short term momentum indicators are recovering from oversold levels and are trending up.
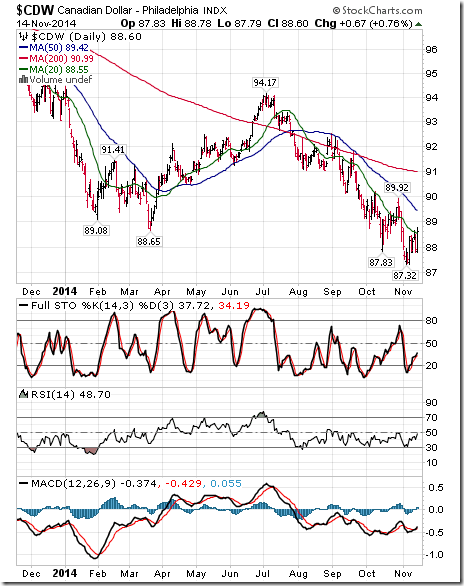
The Canadian Dollar added US0.32 cents (0.36%) last week. Intermediate trend remains down. The Canuck Buck moved above its 20 day moving average on Friday. Short term momentum indicators are recovering from oversold levels and are trending up.
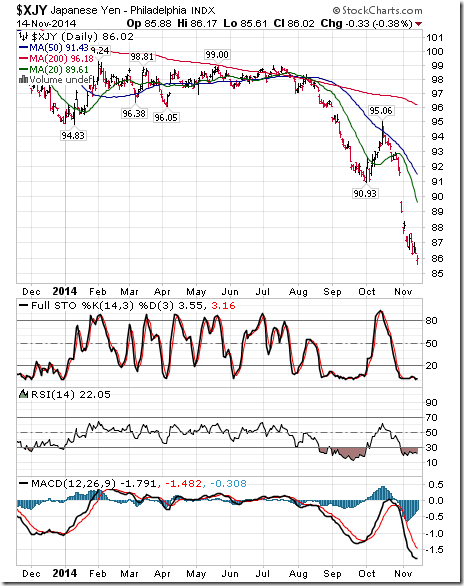
The Japanese Yen dropped another 1.24 (1.42%) last week. Intermediate trend remains down. The Yen remains below its 20 day moving average. Short term momentum indicators are trending down and are oversold.
Commodities
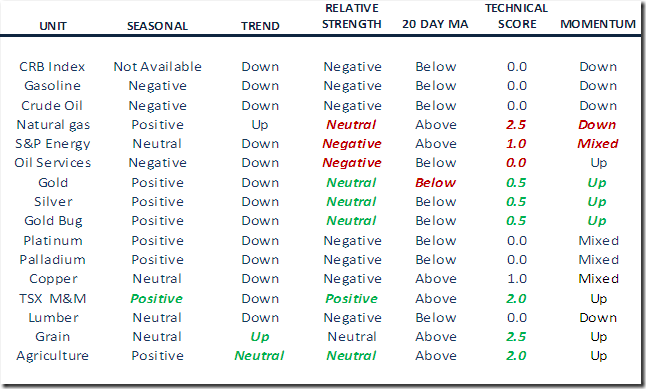
Summary of Weekly Seasonal/Technical Parameters for Commodity Indices/ETFs
Seasonal: Positive, Negative or Neutral on a relative basis applying EquityClock.com charts
Trend: Up, Down or Neutral
Strength relative to the S&P 500 Index: Positive, Negative or Neutral
Momentum based on an average of Stochastics, RSI and MACD: Up, Down or Mixed
Green: Upgrade
Red: Downgrade
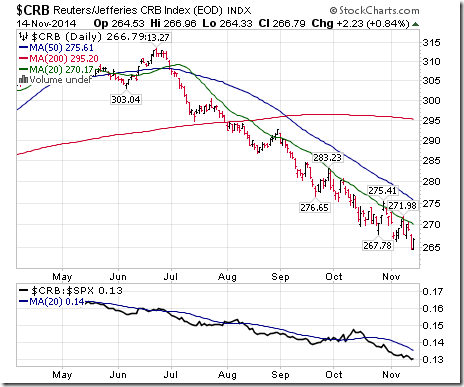
The CRB Index fell another 3.74 points (1.38%) last week. Intermediate trend remains down. The Index remains below its 20 day moving average. Strength relative to the S&P 500 Index remains negative. Technical score remains at 0.0 out of 3.0. Momentum indicators are trending down, but are oversold
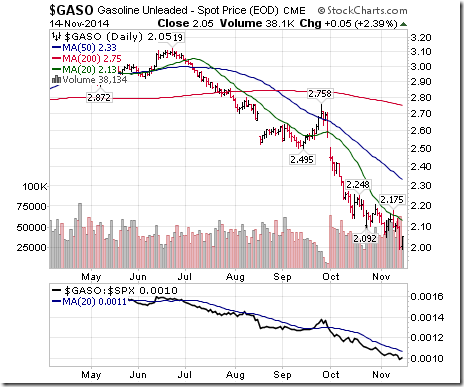
Gasoline fell another $0.08 per gallon (3.76%) last week. Intermediate trend remains down. Gas remains below its 20 day moving average. Strength relative to the S&P 500 Index remains negative. Technical score remains at 0.0 out of 3.0. Short term momentum indicators are trending down, but are oversold.
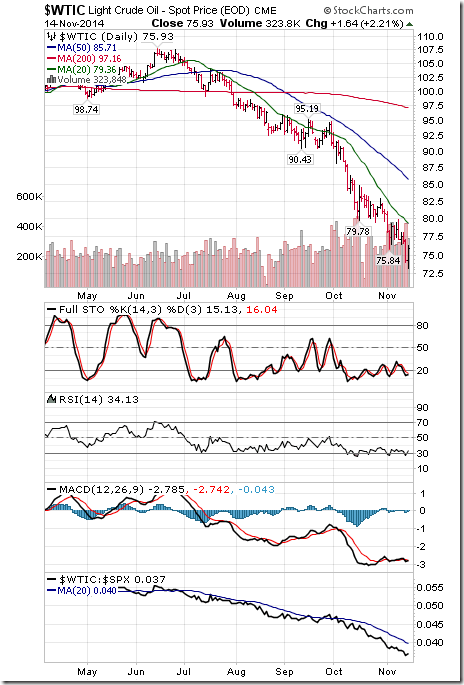
Crude Oil fell another $2.50 per barrel (3.19%) last week. Intermediate trend remains down. Crude remains below its 20 day moving average. Strength relative to the S&P 500 Index remains negative. Technical score remains at 0.0 out of 3.0. Short term momentum indicators are trending down, but are oversold and showing early signs of bottoming.
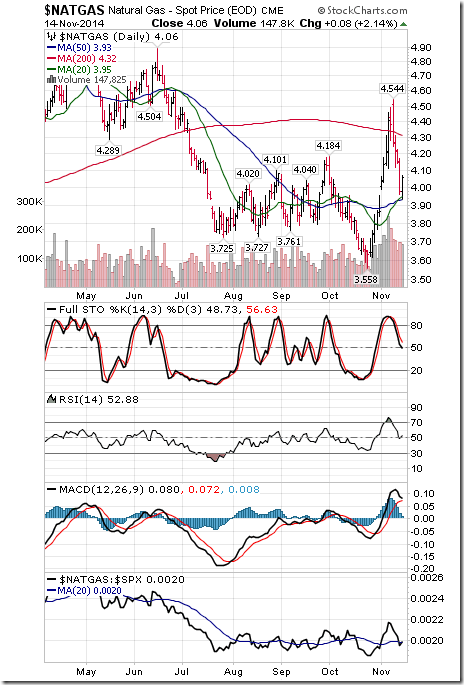
Natural Gas fell $0.32 per MBtu (7.31%) last week. Intermediate trend remains up. “Natty” remains above its 20 day moving average. Strength relative to the S&P 500 Index changed to neutral from positive. Technical score slipped to 2.5 from 3.0 out of 3.0. Short term momentum indicators are trending down.
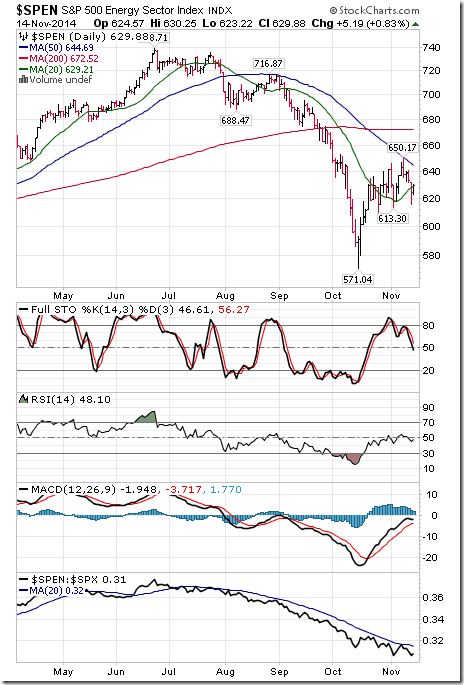
The S&P Energy Index fell 12.92 points (2.01%) last week. Intermediate trend remains down. The Index remains above its 20 day moving average. Strength relative to the S&P 500 Index changed to negative to neutral. Technical score slipped to 1.0 from 1.5 out of 3.0. Short term momentum indicators are mixed
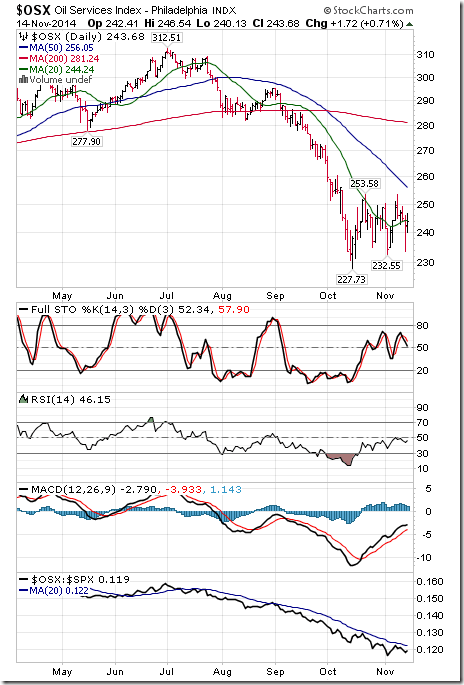
The Philadelphia Oil Services Index dropped 5.16 points (2.07%) last week. Intermediate trend remains down. The Index moved below its 20 day moving average. Strength relative to the S&P 500 Index remains negative. Technical score dropped to 0.0 from 1.0 out of 3.0. Short term momentum indicators are trending up
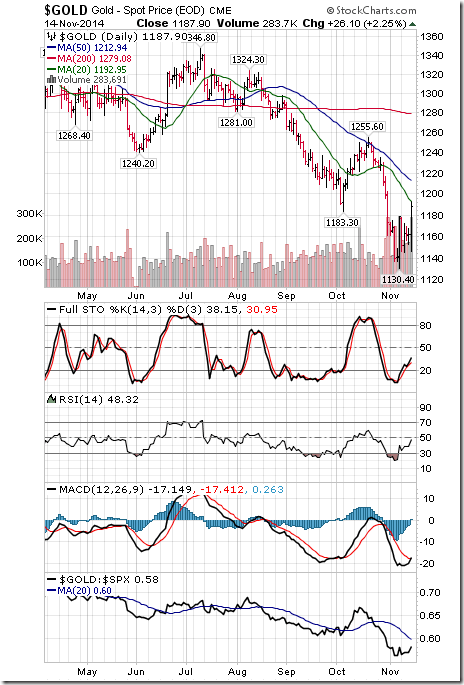
Gold gained $9.20 per ounce (0.78%) last week. Intermediate trend remains down. Gold remains below its 20 day moving average. Strength relative to the S&P 500 Index changed from negative to neutral. Technical score improved to 0.5 from 0.0. Short term momentum indicators are trending up.
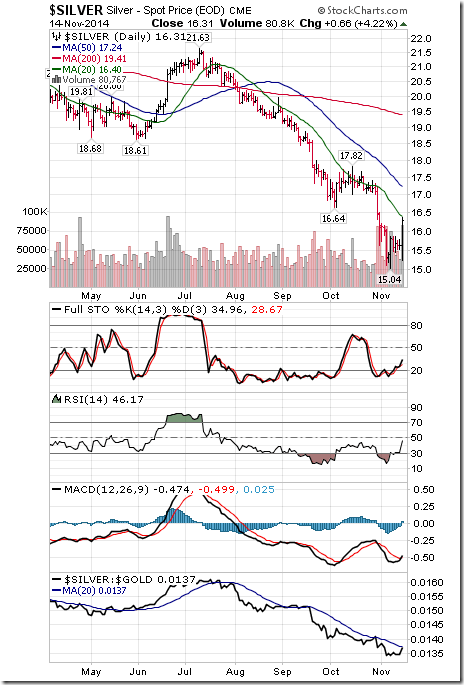
Silver gained $0.50 per ounce (3.16%) last week. Intermediate trend remains down. Silver remains below its 20 day moving average. Strength relative to the S&P 500 Index and Gold changed to neutral from negative. Technical score improved to 0.5 from 0.0 out of 3.0. Short term momentum indicators are trending up.
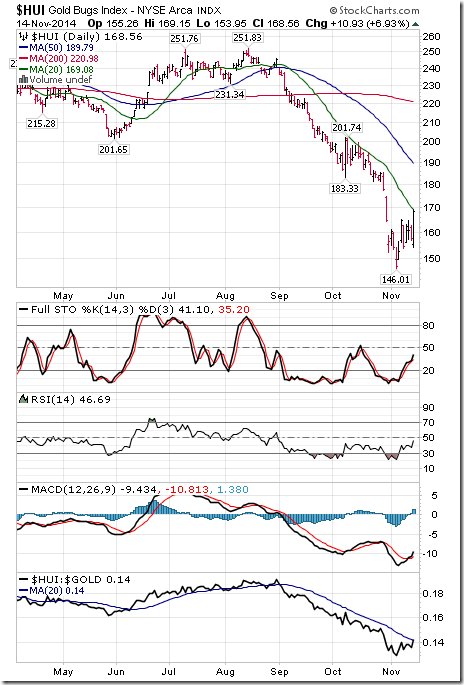
The AMEX Gold Bug Index gained 4.02 points (2.44%) last week. Intermediate trend remains down. The Index remains below its 20 day moving average. Strength relative to the S&P 500 Index and Gold changed to neutral from negative. Technical score improved to 0.5 from 0.0. Short term momentum indicators are trending up
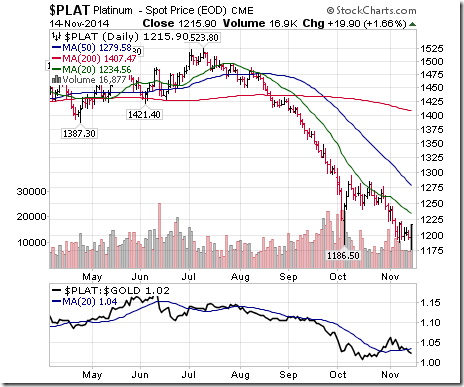
Platinum slipped $2.00 per ounce (0.16%) last week. Intermediate trend remains down. PLAT remains below its 20 day MA. Strength relative to the S&P 500 and Gold remains negative
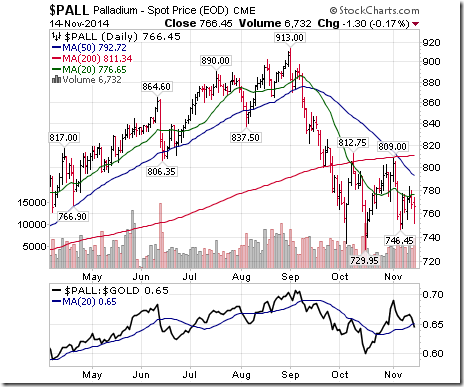
Palladium fell $7.05 per ounce (0.91%) last week. Intermediate trend remains down. PALL remains below its 20 day moving average. Strength relative to the S&P 500 Index remains negative. Strength relative to Gold turned negative.
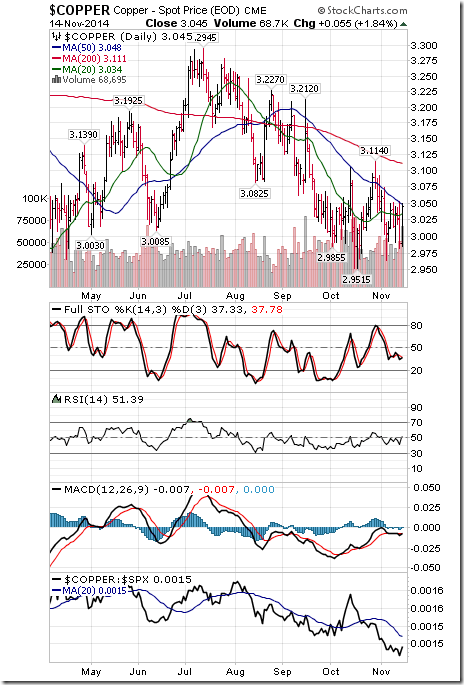
Copper added 0.006 per lb. (0.20%) last week. Intermediate trend remains down. Copper remains above its 20 day moving average. Strength relative to the S&P 500 Index remains negative. Technical score remained at 1.0 out of 3.0. Short term momentum indicators are mixed.
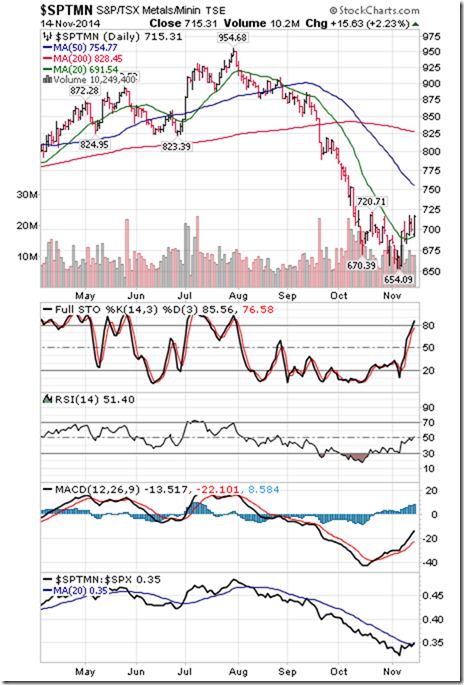
The TSX Metals & Minerals Index added 17.60 points (2.52%) last week. Intermediate trend remains down. The Index remains above its 20 day moving average. Strength relative to the S&P 500 Index changed to positive from negative. Technical score improved to 2.0 from 1.0 out of 3.0. Short term momentum indicators are trending up.
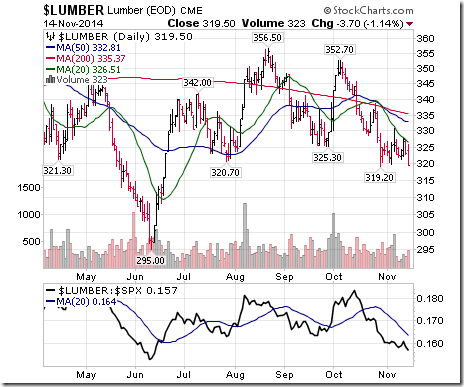
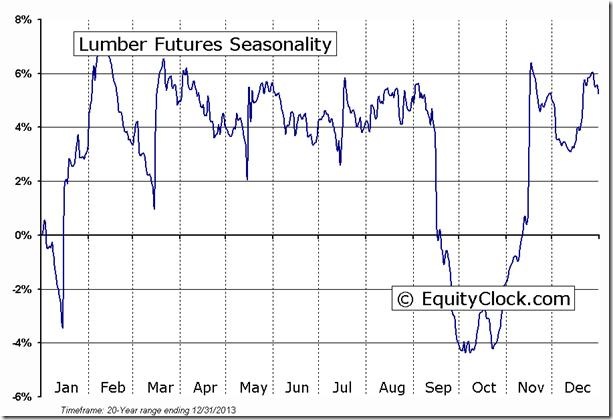
Lumber fell $3.30 (1.02%) last week. Intermediate trend remains down. Lumber remains below its 20 day MA. Strength relative to the S&P 500 Index remains negative. Technical score: 0.0.
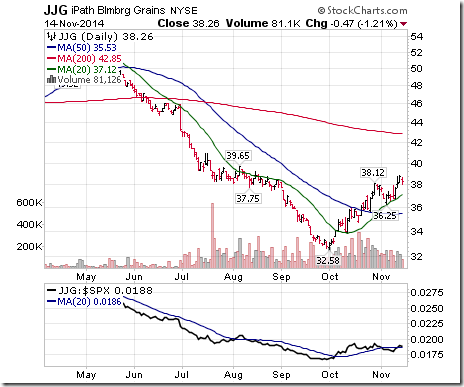
The Grain ETN added $1.29 (3.49%) last week. Intermediate trend changed to up from down on a move above $38.12. Strength relative to the S&P 500 Index remains neutral. Technical score improved to 2.5 from 1.5 out of 3.0. Short term momentum indicators are trending up.
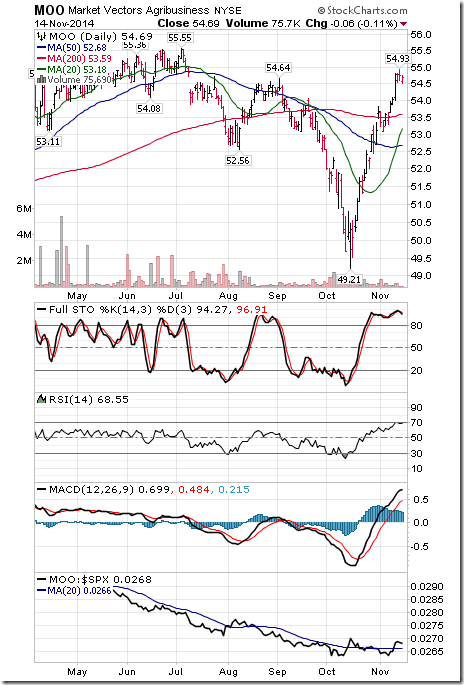
The Agriculture ETF added $0.80 (1.48%) last week. Intermediate trend changed from down to neutral on a move above $54.64. Units remain above their 20 day moving average. Strength relative to the S&P 500 Index changed to neutral from negative. Technical score improved to 2.0 from 1.0 out of 3.0. Short term momentum indicators are trending up.
Interest Rates
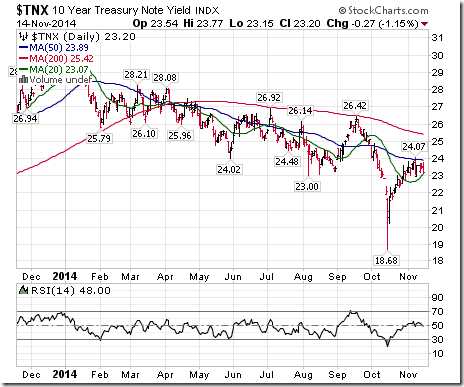
The yield on 10 year Treasuries added 0.8 basis points (0.35%) last week. Intermediate trend remains down. Yield remains above its 20 day moving average. Short term momentum indicators are mixed.
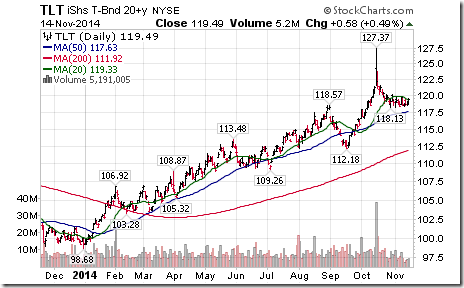
Conversely, price of the long term Treasury ETF slipped $0.26 (0.22%) last week. Intermediate trend remains up. Price remains below its 20 day moving average.
Other Issues
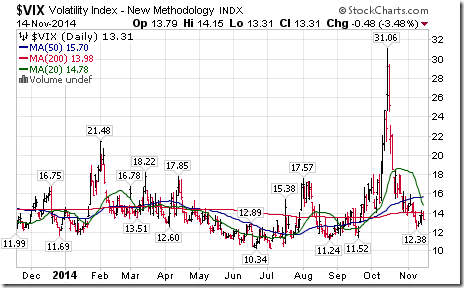
The VIX Index slipped 0.40 (2.92%) last week. Intermediate trend remains up. The Index remains below its 20 day moving average.
Economic news this week on both sides of the border is expected to confirm growth, but at a slightly decelerated rate.
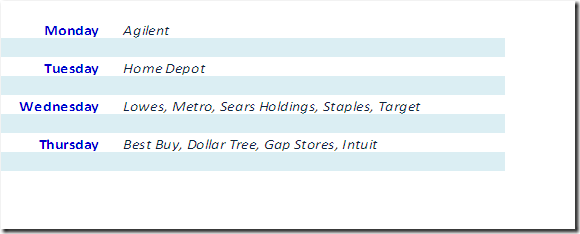
Earnings focus this week is on retail merchandiser companies.
Short term momentum indicators for most equity markets and sectors are trending higher, but are overbought.
North American equity markets have a history of moving in a relative narrow range during the next ten days followed by two consecutive days that historically are exceptionally strong: the day before and the day after U.S. Thanksgiving Day (November 27th this year).
Seasonal influences for economic sensitive sectors generally are positive until at least the first week in January.
The Bottom Line
Preferred strategy is to hold current equity positions and to add to positions on weakness. Preferred sectors included Technology, Consumer Discretionary, Industrials and Materials.
Possible sleeper: Mines & Metals! The sector enters its period of seasonal strength next week. Individual stocks in the sector are showing early technical signs of bottoming at oversold levels.
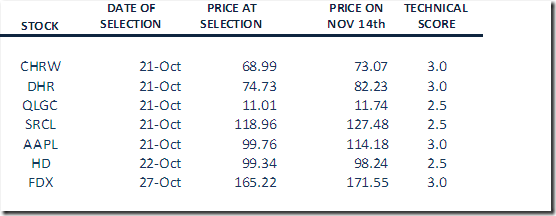
Monitored List of Technical/Seasonal Ideas
Green: Increased score
Red: Decreased score
A score of 1.5 or higher is needed to maintain a position
Canfor and West Fraser were deleted from the list at the close on Friday at a profit of 9.3% after the period of seasonal strength for lumber changed from positive to neutral.
FUTURE_LB1 Relative to the S&P 500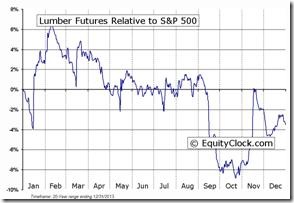 |
Disclaimer: Comments, charts and opinions offered in this report by www.timingthemarket.ca and www.equityclock.com are for information only. They should not be considered as advice to purchase or to sell mentioned securities. Data offered in this report is believed to be accurate, but is not guaranteed. Don and Jon Vialoux are Research Analysts with Horizons ETFs Management (Canada) Inc. All of the views expressed herein are the personal views of the authors and are not necessarily the views of Horizons ETFs Management (Canada) Inc., although any of the recommendations found herein may be reflected in positions or transactions in the various client portfolios managed by Horizons ETFs Management (Canada) Inc.
Individual equities mentioned in StockTwits are not held personally or in HAC.
Horizons Seasonal Rotation ETF HAC November 14th 2014
Copyright © Don Vialoux, EquityClock.com


