by Don Vialoux, Timing the Market
(Editor’s Note: Mr. Vialoux is appearing on BNN’s Market Call at 1:00 PM EDT today.
Pre-opening Comments for Friday August 22nd
U.S. equity index futures were lower this morning. S&P 500 futures were down 3 points in pre-opening trade. Traders are waiting for comments by Federal Reserve Chairwoman Janet Yellen at 10:00 AM EDT.
The Canadian Dollar improved slightly following release of economic news at 8:30 AM EDT. Consensus for July Consumer Prices was a decline of 0.1% on a month-over-month basis. Actual was a decline of 0.1%. On a year-over-year basis, July CPI increased 2.1%. Consensus for June Retail Sales was an increase of 0.4%. Actual was a gain of 1.1%.
Royal Bank added $0.44 to US$75.09 after increasing its dividend by $0.04 per share.
Deere dropped $0.92 to $85.29 after Macquarie downgraded the stock from Neutral to Underperform.
Gap Stores gained $1.14 to $33.32 after Janney Capital upgraded the stock from Neutral to Buy. The company reported higher than consensus second quarter earnings overnight.
EquityClock.com’s Daily Market Letter
Following is a link:
http://www.equityclock.com/2014/08/21/stock-market-outlook-for-august-22-2014/
Interesting Charts
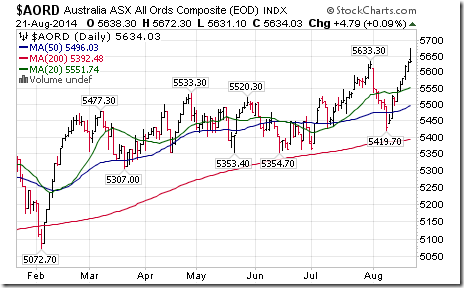
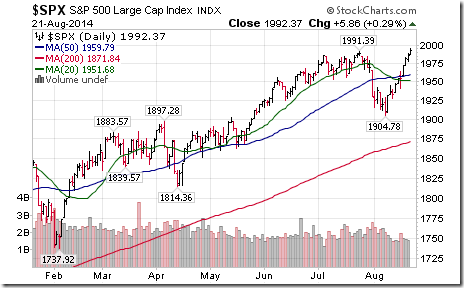
More equity indices moved to multiple year highs! The Australia All Ordinaries Composite Index closed at a 6 year high.
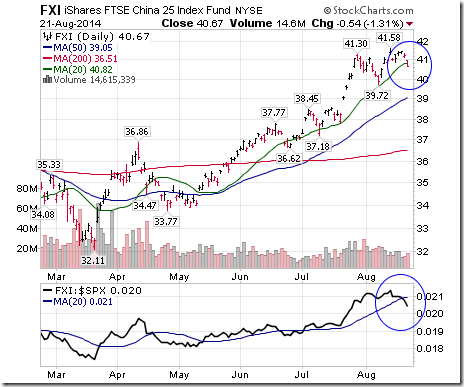
A word of caution on Chinese equities and related ETFs/closed end funds! Early technical signs of a peak have been recorded. Time to take profits!
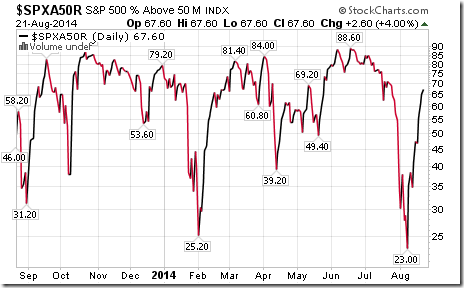
S&P 500 stocks trading above their 50 day moving average are approaching intermediate overbought levels, but have yet to show signs of peaking.
StockTwits Released Yesterday
The S&P 500 Index touched an all-time high. Technical action by S&P stocks to 10:45 remains bullish. 11 stocks broke resistance and 2 stocks broke support.
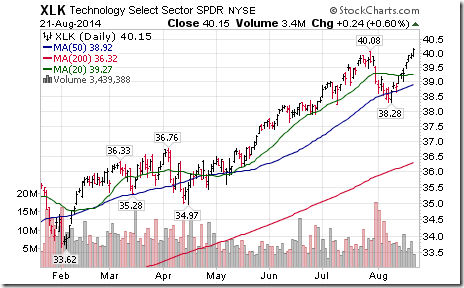
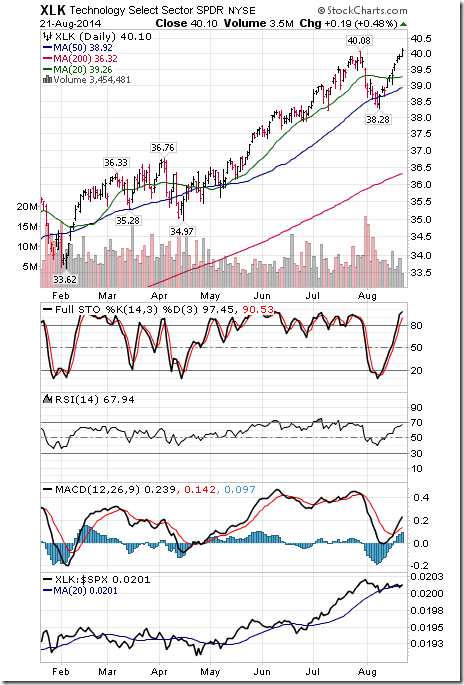
$XLK broke resistance at $40.08 to reach a 13 year high.
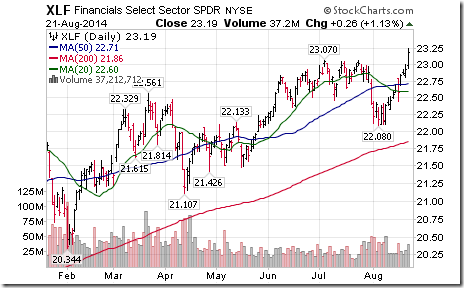
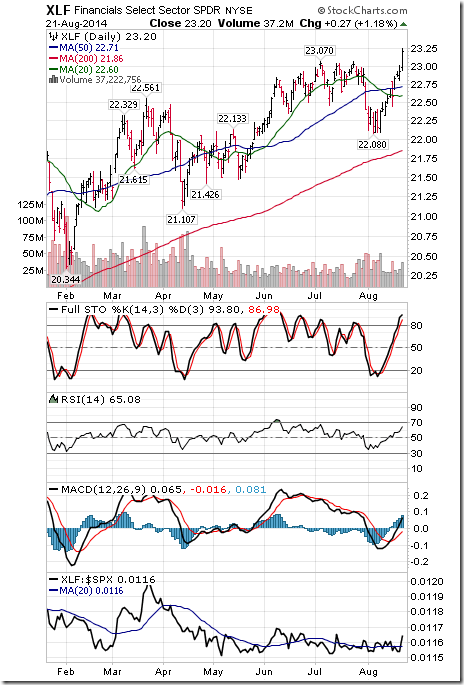
$XLF broke resistance at $23.07 to reach a 6 year high.
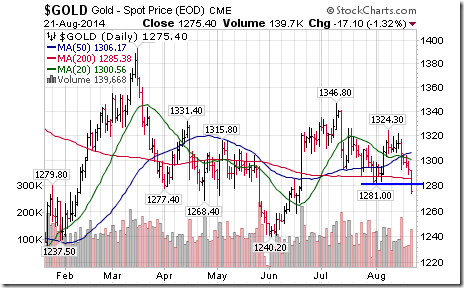
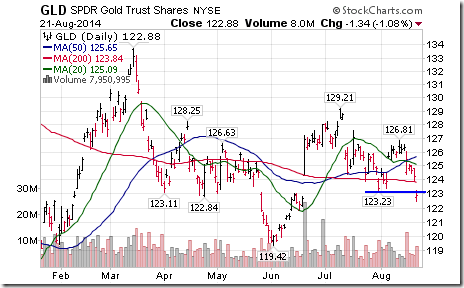
Gold broke support at $1,281 and $GLD broke support at $123.23
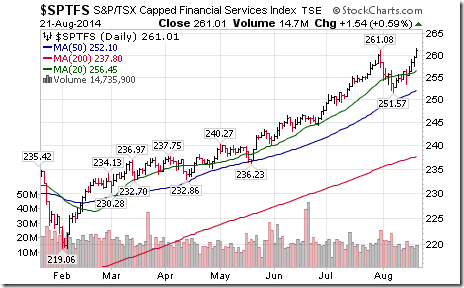
$SPTFS (Canadian Financial Services) broke above resistance at 261.08 to reach an all-time high.
Technical action by individual equities
By the close, 23 S&P 500 stocks had broken resistance and two stocks had broken support.
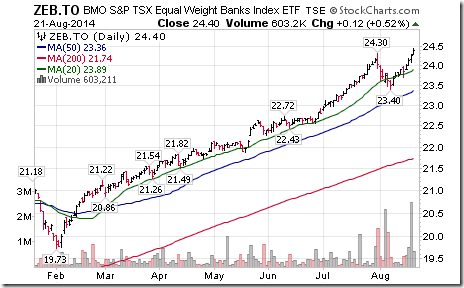
Among S&P 500 stocks, another two bank stocks broke to all-time highs: BMO and NA. Canadian bank stocks led the TSX Composite on the upside.
Weekly Technical Review of Select Sector SPDRs
Technology
· Intermediate uptrend was confirmed by a break to an all-time high
· Units remain above their 20 day moving average.
· Strength relative to the S&P 500 Index changed to neutral from positive
· Technical score based on the above indicators slipped to 2.5 from 3.0
· Short term momentum indicators are trending up.
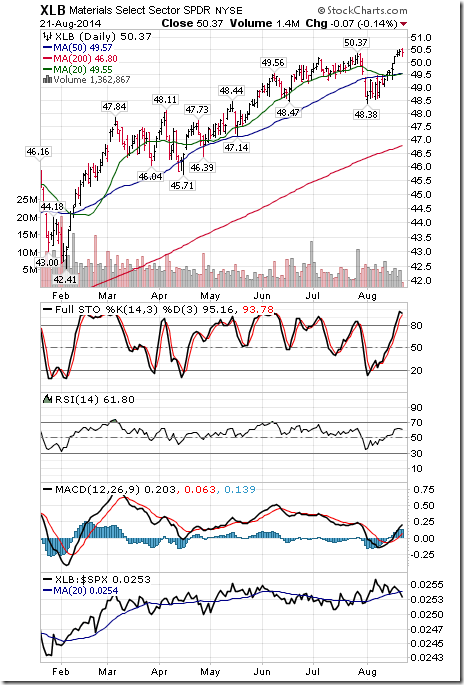
Materials
· Intermediate trend changed to up when units broke to an all-time high
· Units remain above their 20 day moving average
· Strength relative to the S&P 500 Index changed to negative from neutral
· Technical score improved to 2.0 from 1.5
· Short term momentum indicators are trending up.
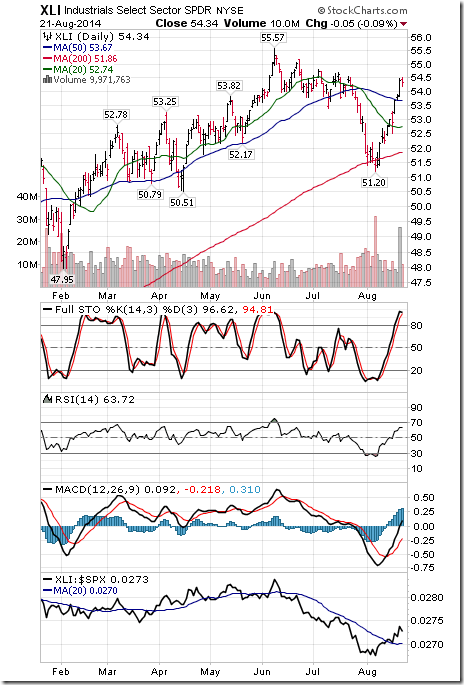
Industrials
· Intermediate trend remains down
· Units remain above their 20 day moving average
· Strength relative to the S&P 500 Index improved to positive from neutral
· Technical score improved to 2.0 from 1.5
· Short term momentum indicators are trending up.
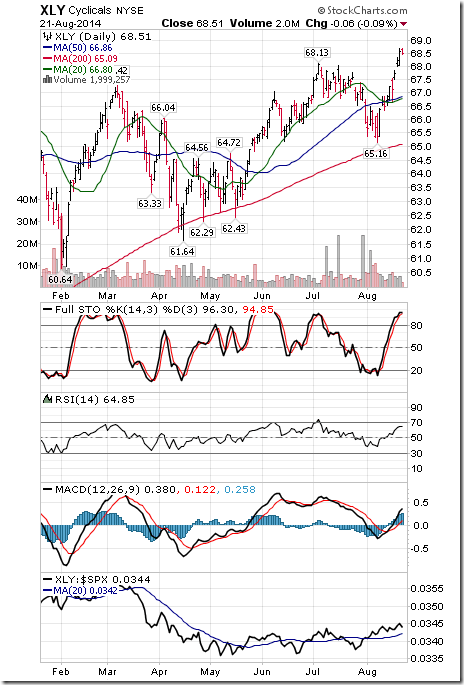
Consumer Discretionary
· Intermediate trend changed to up from down on a move above $68.13 to an all-time high
· Units remain above their 20 day moving average
· Strength relative to the S&P 500 Index remains positive
· Technical score improved to 3.0 from 2.0
· Short term momentum indicators are trending up
Financials
· Intermediate trend changed to up from down on a move above $23.07 to a six year high.
· Units remain above their 20 day moving average
· Strength relative to the S&P 500 Index changed to positive from neutral
· Technical score improved to 3.0 from 1.5 out of 3.0
· Short term momentum indicators are trending up.
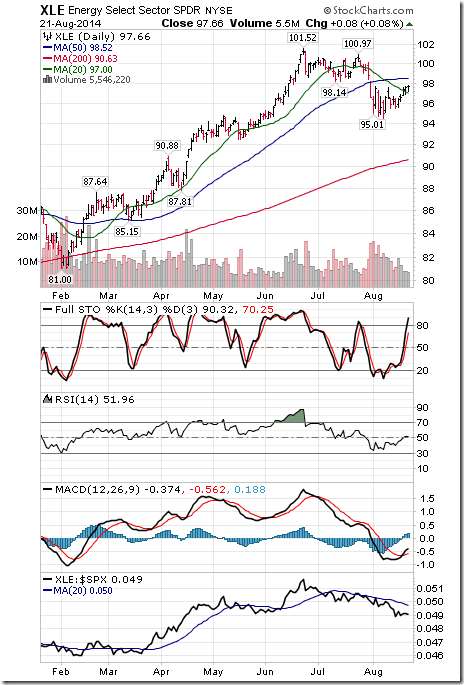
Energy
· Intermediate trend remains down
· Units moved above their 20 day moving average
· Strength relative to the S&P 500 Index remains negative
· Technical score improved to 1.0 from 0.0 out of 3.0.
· Short term momentum indicators are trending up.
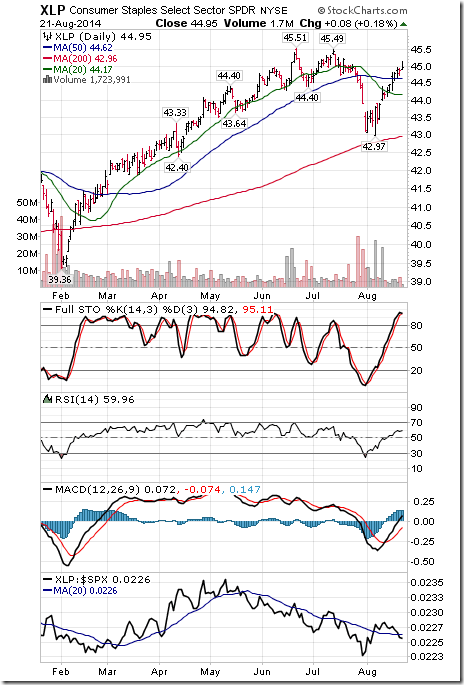
Consumer Staples
· Intermediate trend remains down.
· Units remain above their 20 day moving average
· Strength relative to the S&P 500 Index remains neutral.
· Technical score remains at 1.5 out of 3.0
· Short term momentum indicators are trending up
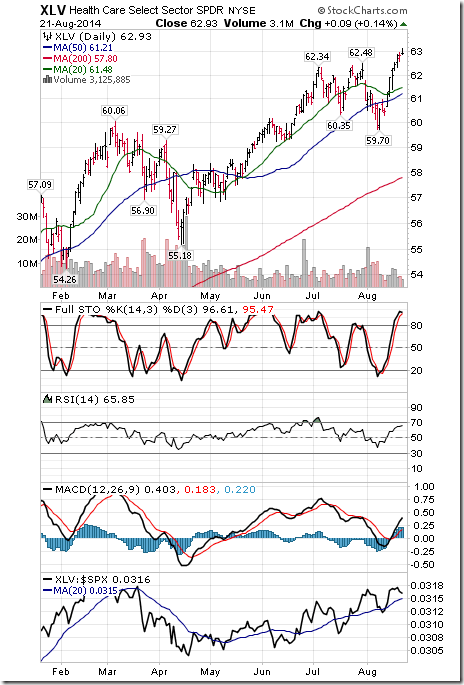
Health Care
· Intermediate trend changed to up from neutral on a move above $62.48 to all-time high
· Units remain above their 20 day moving average
· Strength relative to the S&P 500 Index remains positive
· Technical score remains at 3.0 out of 3.0
· Short term momentum indicators are trending up.
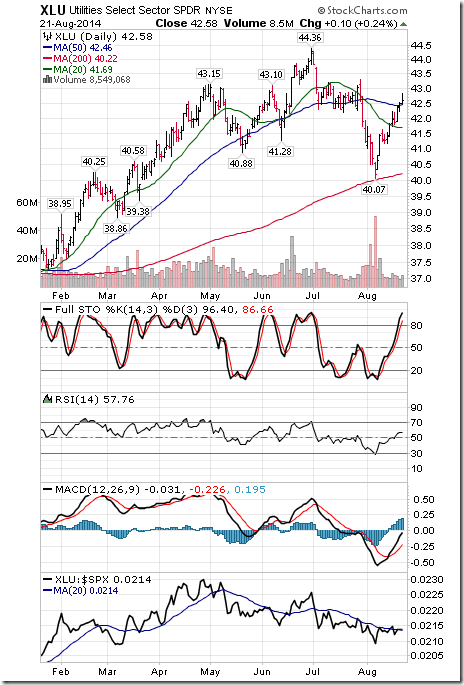
Utilities
· Intermediate trend remains down
· Units remain above their 20 day moving average
· Strength relative to the S&P 500 Index remains neutral.
· Technical score remains at 1.5 out of 3.0
· Short term momentum indicators are trending up.
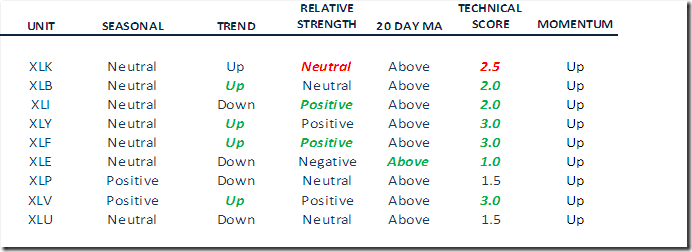
Summary of Weekly Seasonal/Technical Parameters for SPDRs
Key:
Seasonal: Positive, Negative or Neutral on a relative basis applying EquityClock.com charts
Trend: Up, Down or Neutral
Strength relative to the S&P 500 Index: Positive, Negative or Neutral
Momentum based on an average of Stochastics, RSI and MACD: Up, Down or Mixed
Twenty Day Moving Average: Above, Below
Green: Upgrade from last week
Red: Downgrade from last week
Special Free Services available through www.equityclock.com
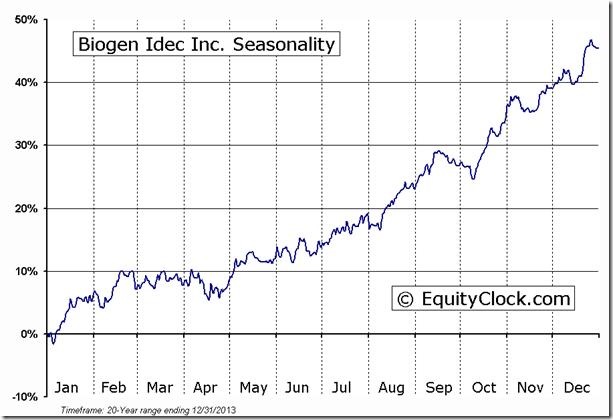
Equityclock.com is offering free access to a data base showing seasonal studies on individual stocks and sectors. The data base holds seasonality studies on over 1000 big and moderate cap securities and indices. To login, simply go to http://www.equityclock.com/charts/
Following is an example
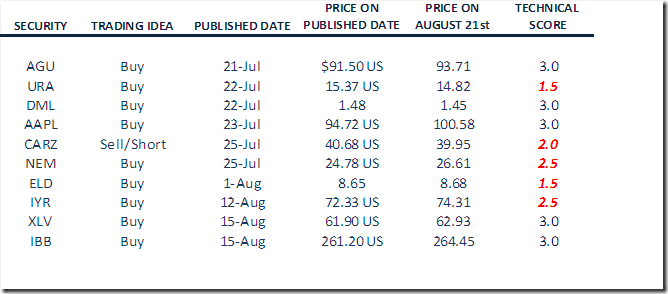
Monitored Technical/Seasonal Trade Ideas
A security must have a Technical Score of 1.5 – 3.0 to be on this list.
Green: Increased Technical Score
Red: Reduced Technical Score
Editor’s Notes:
Cameco was deleted from the Monitored list after its technical score fell below 1.5. The stock was downgraded yesterday by Cowen. Loss in the trade was 5.3%.
Several gold equities were deleted after the price of gold broke support and technical scores on selected equities fell below 1.5. XGD was deleted at a profit of 1.8%. HGU was deleted at a profit of 3.9%. HEP was deleted at a profit of 0.3%. ZJG was deleted at a profit of 1.4%. YRI was deleted at a loss of 3.2%. All saw their technical score fall to 1.0. Don’t be surprised if these securities reappear on the list if technical scores recover.
Disclaimer: Comments, charts and opinions offered in this report by www.timingthemarket.ca and www.equityclock.com are for information only. They should not be considered as advice to purchase or to sell mentioned securities. Data offered in this report is believed to be accurate, but is not guaranteed. Don and Jon Vialoux are Research Analysts with Horizons ETFs Management (Canada) Inc. All of the views expressed herein are the personal views of the authors and are not necessarily the views of Horizons ETFs Management (Canada) Inc., although any of the recommendations found herein may be reflected in positions or transactions in the various client portfolios managed by Horizons ETFs Management (Canada) Inc.
Individual equities mentioned in StockTwits are not held personally or in HAC.
Horizons Seasonal Rotation ETF HAC August 21st 2014
Copyright © Don Vialoux, Jon Vialoux, Brooke Thackray


