Inflation Blues: Is it Time to Start Worrying?
March 3, 2014
Key Points
- Inflation was revised higher in the latest GDP revision; while an increase in the minimum wage could push it higher still.
- But we remain sanguine about inflation risk as long as velocity and wage growth remain low.
- The key to watch near-term is bank lending, which is starting to accelerate sharply; signaling the possible return of "animal spirits."
From the onset of the Fed's several quantitative easing (QE) programs I've been asked about inflation risk. The questions in the early years (2008-2012) were pervasive; based on the assumption that the Fed's pumping of so much money into the system was setting up an inflation problem. Over that same span, we were much more sanguine about inflation risk and that stance was highlighted in one of the first Investment Ideas we initiated about a year ago. It laid out the case for low inflation risk and why certain "obvious" inflation plays- like gold and Treasury Inflation-Protected Securities (TIPS)- were not likely to be good investments. That Idea worked quite well and we closed it out later in 2013 with stellar performance.
Why inflation feels higher than stated
Before I get to the discussion, let me say up front that I am keenly aware than most people "feel" and "see" inflation that seems well higher than the government-stated numbers. The reason the Federal Reserve, the government and many market-watchers look at "core" inflation and not overall inflation is the volatility associated with food and energy prices. Those are taken out of the overall inflation reading to get the core reading. Theoretically, the core inflation rate more accurately reflects price increases without taking into account the often-rampant volatility of food and energy prices impacted by geopolitics and weather.
Indeed, energy and food prices have increased at a much faster pace than core items. Food prices are up at about twice the rate of core inflation over the past year; while energy prices are up more than seven times core. That's why what we feel on a day-to-day basis is quite different than the stated core readings on inflation. But what no one should want is a Federal Reserve that moves its interest rate levers in reaction to food and energy prices rising for non-economic reasons.
Dusting off some inflation indicators
We remain sanguine about core inflation risk in the near-term, but I think it's time to dust off the indicators on which we're keeping our eyes to judge if/when inflation becomes part of the investment conversation again.
We did see an upward revision to the inflation measure that's imbedded in gross domestic product (GDP) when we got the revision to fourth quarter growth last week. The core personal consumption expenditure (PCE) price index was revised to a 1.3% annual rate from 1.1%; while the overall price index was revised to 1.6% from 1.3%.
But wages impact inflation and there's no indication we're at risk of the kind of "wage-price-spiral" that characterized the high-inflation era of the late-1970s/early-1980s. That said, there are some signs of wage pressures building in several industries; notably those that employ higher-skilled workers.
Wages Impact Inflation
Source: Bureau of Labor Statistics, FactSet, as of January 31, 2014.
At the same time, capacity utilization remains low and is not yet in a range that would trigger higher wage gains (which is to the chagrin of workers, obviously).
Capacity Utilization Impacts Wages
Source: ISI Group, as of March 3, 2014.
Minimum wage effects
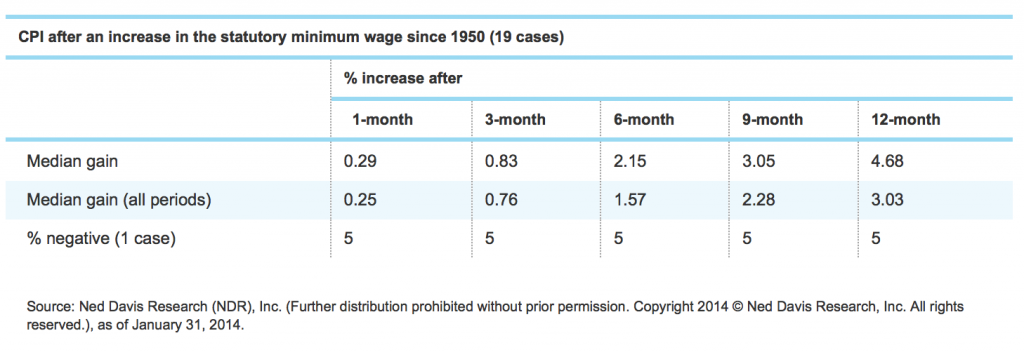
As an aside, given the heated debate underway about an increase to the minimum wage, I wanted to highlight the findings by Ned Davis Research as it relates to inflation. Raising the minimum wage could create some "cost-push" inflation as businesses would likely raise prices to cover the higher operating expenses. Based on history, in the 12 months after an increase in the minimum wage, the Consumer Price Index (CPI) tended to rise more than the median increase over all periods.
QE, velocity and its impact on inflation
The Federal Reserve has begun tapering QE; the first cut of $10 billion occurred in December 2013 and the second $10 billion followed a month later. That means the Fed is now buying $65 billion a month of Treasury and mortgage-backed securities. Before we get to subject of inflation, let's first remind folks that tapering is not tightening. The Fed is still adding $65 billion per month to its balance sheet. Think of it like a driver taking his foot off the accelerator … he's still moving … very different than if the driver had slammed on the brake.
In the chart below, you can see the Fed's balance sheet, with the yellow part of the line at the end showing the expected path through year-end 2014.
Fed’s Balance Sheet Still Rising
Source: FactSet, Federal Reserve, as of February 21, 2014.
Many investors who have been concerned about inflation only focused on the chart above; highlighting the excess liquidity pumped into the system. But it's the "velocity" of money that drives inflation (as well as economic growth). The chart below shows velocity- also often referred to as the "money multiplier"- which is calculated by dividing M2 money supply by the monetary base (the Fed's balance sheet). It measures whether that money being pumped into the system is getting out into the economy via lending and picking up velocity.
Money Velocity Still Weak
Source: FactSet, Federal Reserve, as of February 21, 2014.
Why velocity remains low
There are several reasons why the massive increase in the Fed's balance sheet has not unleashed the inflation monster. The last time the monetary base increased to a similar degree was in the late 1940s. Barclay's tackled the subject in a report in January and highlighted several disinflationary forces uniquely present today:
- US energy revolution
- Uncompetitive European unit labor costs, which despite policy impediments, need to adjust further
- Capital "malinvestment" in the developing world
- Banking system deleveraging and tighter regulation
- Excessive developed world debt
These are all constraints on velocity and sharply higher inflation; none of which are going away any time soon.
Bank deposits swamping lending
Another way to understand velocity is to look at the spread between bank deposits and bank lending. Since 2008, a gap of $2.5 trillion has opened between bank deposits of nearly $10 trillion and bank lending of less than $7.5 trillion. This spread is unprecedented in history. The weakness in bank lending helps to explain the anemic nature of the recovery so far; but it also helps explain the low level of inflation we've seen.
Record Gap Between Bank Deposits and Lending
Source: FactSet, Federal Reserve, as of February 21, 2014.
But bank lending is now on a significant upswing as you can see in the shorter time frame chart below. In addition, M2 money supply has increased nearly $150 billion over the past five weeks; up 6.6% year-over year. If this acceleration has legs, the recovery could finally begin to feel like more of an actual expansion; but it could also usher in fears of inflation.
Bank Lending Now Surging
Source: FactSet, Federal Reserve, as of February 21, 2014.
Wage trends tend to be over longer cycles; but bank lending can pick up sharply, particularly if "animal spirits" kick in among consumers and businesses. We'll be keeping an eye on lending and velocity and will keep you informed if we see the risk of inflation begin to rise.


