by Edward Miller, CMT, Charts, Etc.
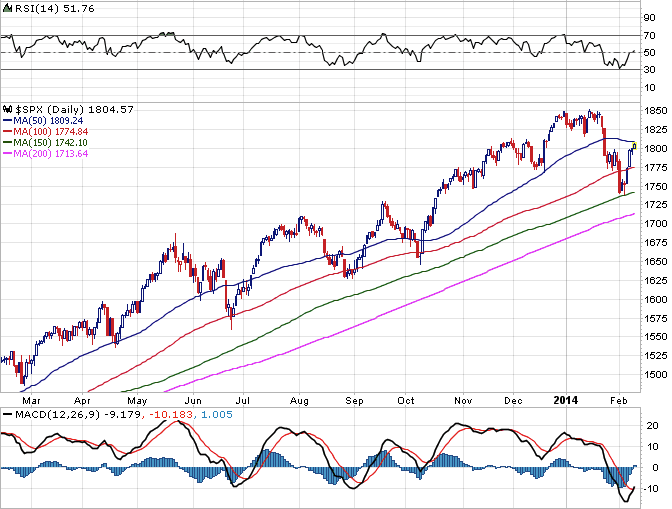
With regards to a market bottom, last Monday I wrote that for starters I'd like to see 1) the S&P 500 put together three consecutive up days off this low or one significant up day with a bar/candle range spanning 15-20+ points, and 2) the MACD to trigger a buy signal, i.e. for a bullish crossover to occur in the 12- and 26-day EMAs, also shown with a positive histogram. As of today, it appears both of these conditions have been met.
Source: Stockcharts.com
The S&P 500 chart above shows three consecutive up days (including two fairly wide bars) and the MACD histogram turning positive. Granted, I would prefer to see a more meaningful buy signal from the MACD, but it's moving in the right direction. It's also encouraging to see the RSI (upper inset) get back above 50.
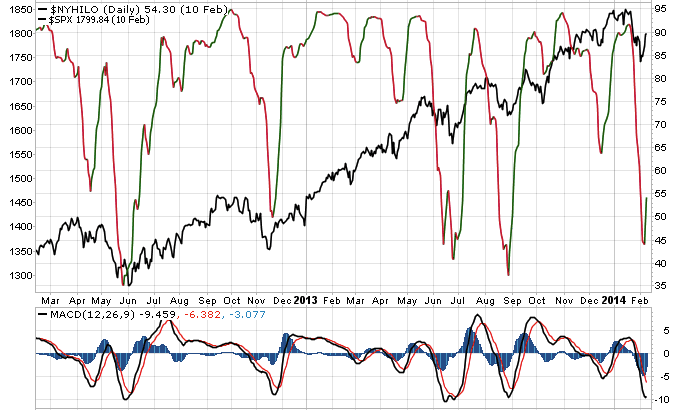
The NYSE High-Low Index is rising off an oversold level:
Typically when this index first rises from such a low level, it suggests a bottom is near. However, given the compressed severity of this recent correction, it wouldn't be unusual for the market to pullback on the heels of this recovery rally. As further confirmation that a credible low has been established, look for the MACD of the NYSE High-Low Index to trigger a buy signal (positive histogram) -- which has yet to happen.


