“Bear Raid?”
by Jeffrey Saut, Chief Investment Strategist, Raymond James
January 27, 2014
I should have guessed that something was wrong when I checked into the Langham Hotel last Thursday only to be told by the valet, “There is a bear on the loose in the neighborhood so watch out.” At first I didn’t believe him, but when I turned the TV on there it was, and as the cameras rolled the news anchor said, “Pasadena police and wildlife officials are warning residents to be on alert for a black bear after it was spotted wandering through backyards. The animal appears to be moving from home to home.” At the time the D-J Industrial Average (INDU/15879.11) was down about 80, but closed the session off 175 points. That left me mumbling, “How appropriate, a bear rambling through the ‘hood’ in Pasadena, California and a bear roaming the canyons of Wall Street.” Obviously the “bear raid” continued on Friday with the INDU losing another 318 points, bringing on growls about the start of a bear market. All of those Bear Boos were reflected in this email from one of our financial advisors:
Hey Jeff, I know you have heard of the Dow Theory buy and sell signals. We are now in a Dow Theory sell signal, meaning the D-J Transport Average (TRAN/7258.72) made a new high unconfirmed by the D-J Industrials. We've been in a Dow Theory buy signal environment for the past two years and now that has reversed. These signals are not short term and only happen at major stock market turns. For instance, we had Dow Theory sell signals 4 times between October of 2007 and February of 2008, which was a precursor to the 2008 carnage. What happened on Thursday/Friday of this week also confirms the bearish Elliott wave pattern.
“Nonsense,” was my response. First, all we have seen is what’s termed an “upside non-confirmation” with the Trannies making a new high while the Industrials did not. That is NOT a Dow Theory “sell signal,” it is as stated an upside non-confirmation. To get a Dow Theory “sell signal” would require the INDU to close below its June 2012 low of 14659.56 with a close by the Trannies below their respective June 2012 low of 6173.86, at least by my method of interpreting Dow Theory. Second, there were not four Dow Theory “sell signals” between October 2007 and February 2008. There was, however, a Dow Theory “sell signal” occurring in November 2007 that I wrote about at the time. Third, there have been numerous Dow Theory “buy signals” since 2009, not just over the last two years. Fourth, Dow Theory also has a lot to do with valuations, and valuations are not expensive with the S&P 500 trading at 14.7x the S&P’s bottom up earnings estimate for 2014. And fifth, I studied Elliott wave theory decades ago and found it to be pretty worthless.
Coincidentally, while the INDU was only open for business four days, the senior index suffered its worse weekly loss (2.6%) since the week of the aforementioned June 2012 lows. Switching from the D-J Industrials to the S&P 500 (SPX/1790.29) makes Friday’s Fade interesting to me. Interesting, because for weeks I have suggested the 1808 to 1813 level was the preferred support zone for the SPX. In Friday’s session the SPX tried valiantly to stay above that zone, but when the sellers finally drove the SPX below said level, the rout was on, leaving the SPX under 1800 for the first time since mid-December. However, readers of these missives should not have been surprised by the two-day downside two-step. To be sure, I have written/commented ad nauseam about the potential for a downside feint that my timing models have been suggesting would arrive at the end of January, or at the beginning of February, for a number of weeks. Well, it likely arrived last week. The question now becomes, “Is this the decline of 5% - 7%, which historically occurs following the 40%+ rally we have experienced since those June 2012 lows, or is it the 10% - 12% pullback I have spoken about that historically happens sometime during the next 12 months?” Great question, and one I cannot answer quite yet, at least until I run the numbers now that I have returned from the West Coast late late last night.
Speaking of the West Coast, I was stunned to see how bad the current water situation is. I have been traveling to LA for more than 40 years and have never seen the aqueducts so barren, nor have I seen the reservoirs down by more than 20 feet. It reminded me of the 100-page industry report I penned in 1989 titled “Water, the Ultimate Resource.” According to yesterday’s Los Angeles Times (as paraphrased):
Southern Californians are facing not one drought but three, interconnected yet distinct, each bringing its own hazards and each requiring its own emergency and long-term responses. The first drought is regional, caused by the lack of rain in our own mountains and our own backyards. ... The second drought is different but related. The same Gulf of Alaska system that usually sends rain south of the Tehachapis also sends storms across the Central Valley and into the higher, colder Sierra Nevada, where the water falls as snow and forms California's greatest natural reservoir, releasing its water later in the year in manageable, and useful, seasonal pulses. ... The third drought is occurring across the Western United States, and especially in the Rocky Mountains, which feed the Colorado River and by extension the other major component, after the Central Valley, of California's agricultural wealth. It also forms a major part of Los Angeles' water portfolio. ... Because these three droughts are interconnected, we rarely suffer from one without dealing with the others, and this year's situation is no different. The vast majority of Californians rely on water that falls in other parts of the state, or even outside the state, and although the multiple sources make water more secure for all of us, shortages usually come all at once.
Indeed, water ... the ultimate resource, and water has been one of my major themes for the past 25 years. Regrettably, investing in water is getting harder and harder because “smart money” has been acquiring public water companies for a very long time. For example, GE bought Ionics in 2004 and then in 2006 bought the last water filtration company in Canada (Zenon). In 2005 3M acquired the water purification company Cuno, which was one of the best pure water “plays” I have seen. While there are still some public water companies to invest in, the two exchange-traded funds probably make the most sense for investors, namely PowerShares Water Resources (PHO/$25.28) and its international brethren PowerShares Global Water (PIO/$22.33).
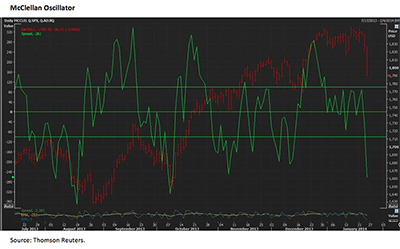
The call for this week: Followers of my work will know that after being rather bullish on the emerging/frontier markets (EMs) when China joined the World Trade Organization in November 2001, for the past few years I have shunned those markets, often stating the only exposure I currently have is in the MFS International Diversification Fund (MDIDX/$15.86) managed by my friend Thomas Melendez. Further, for the last six months I have opined that it was probably 12 – 18 months too soon to wade back into the EMs, unless you wanted to start scale buying them over that 12- to 18-month prescribed timeframe. Unsurprisingly, last week the EMs roiled our stock market as the Latin American currencies collapsed versus the U.S. dollar (Argentina’s currency lost 18%) with a concurrent swoon in our markets. While Americans tend to believe U.S. monetary/fiscal policy should only be concerned with America’s domestic economy, our currency remains the WORLD’S reserve currency, making us also the world’s central banker, a chicken that came home to roost late last week. The nearly 500-point Dow Dive has left the McClellan Oscillator massively oversold (see the chart on the next page where green is oversold) with the next support level at my previous pivot point of 1784 extending down to 1758. But to repeat, there has been NO Dow Theory “sell signal” generated by last week’s action, even though uninformed pundits are suggesting so. Last week, capital flows turned back to “safe havens” like the Japanese yen, Swiss franc, German and U.S. bonds, and yes – the U.S. dollar. This week the Fed will announce its interest rate decision and the pace of QE with the expectation for another “taper” of $10 billion/month to $65 billion. This morning, however, a bounce attempt is underway, but I do not trust it.
Click here to enlarge
Copyright © Raymond James


