


In this week's edition of the SIA Equity Leaders Weekly, we are going to discuss the opportunity cost of your client's investment dollar. With limited resources, this 'Opportunity Cost' is always something to consider as the New Oxford American Dictionary defines it as "the loss of potential gain from other alternatives when one alternative is chosen." What is the risk associated with continuing to hold weak positions after they fall out of favor or purchasing these weak positions with the belief they will rise from the ashes once the position is purchased, versus staying up in the Favored zones and selling positions once they display weakness relative to their peer group?
Blackberry Ltd (BB.TO)
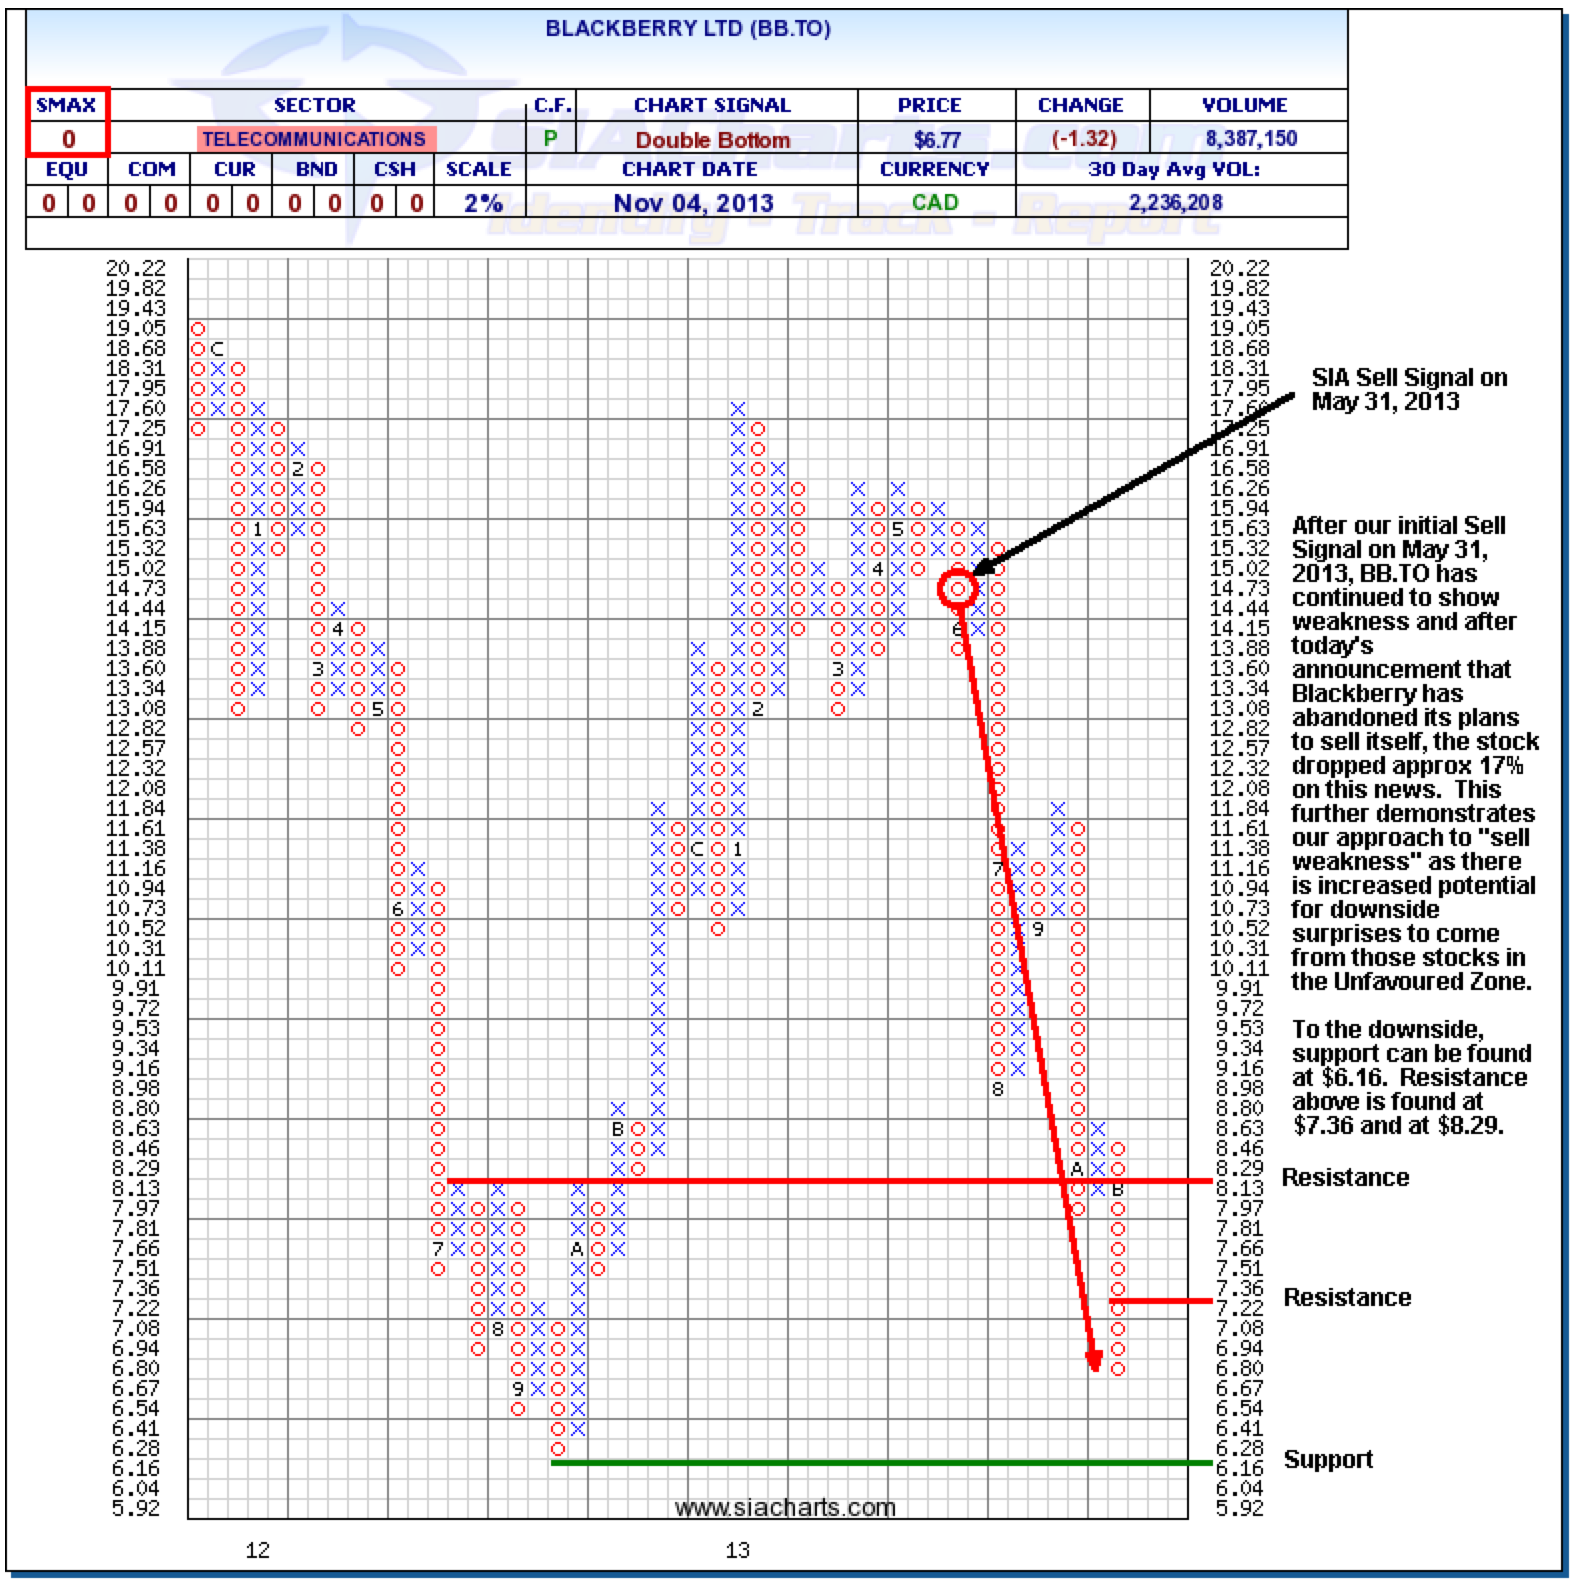
This week bad news came out for Blackberry (BB.TO) yet again that knocked it back down and has the stock now approaching its lows from September of last year. Blackberry stayed out of the Favored zone in the S&P/TSX 60 Report for roughly 3.5 years, before it finally entered again back towards the end of 2012. The last SIA sell signal triggered on May 31, 2013 at $14.45. As of the time of this article, BB.TO was at $6.95 which is a 52% drop after the sell signal occurred.
Understanding the loss is easy for most advisors to comprehend, but what many fail to realize is what could have been done with that money if BB.TO was sold. The proceeds could be used to purchase a relatively stronger position showing less risk from the Favored zone of the same large-cap report instead.
Click on Image to Enlarge
Canadian Pacific Railway Ltd (CP.TO)
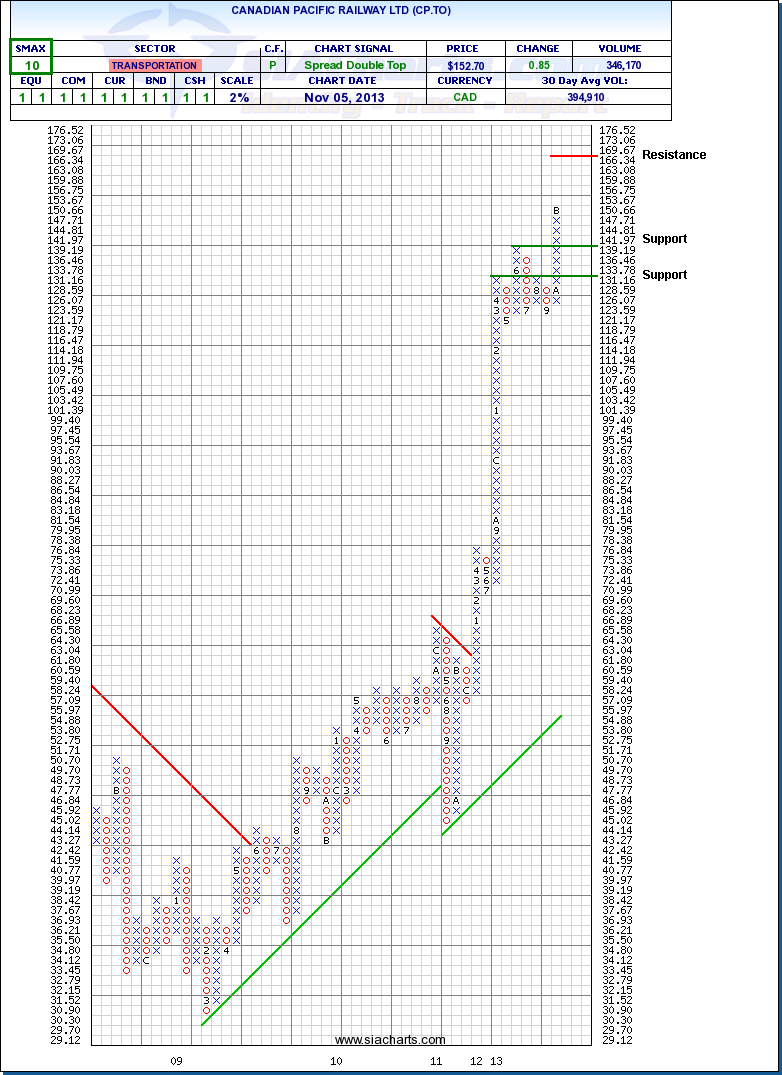
On May 31, 2013 when BB.TO triggered the sell signal, the top positions were VRX.TO, CP.TO, MG.TO, and GIL.TO. Since that day, those 4 stocks are up 20%, 11%, 29%, and 17% respectively. To be conservative, we will use CP.TO as the example. Instead of dropping 52% by holding BB.TO, the advisor who chose to eliminate the weakness and instead replace that position with a stronger one which was up 11% instead for a possible +63% net.
This is what we are referring to when we discuss the opportunity cost. Not only is the advisor damaging the portfolio by holding on to the weak position, but they also miss out on using those investment dollars to provide better returns for the client.
One interesting point: We have heard from different advisors using SIACharts who have gone in and sold these underperforming assets, and as a result, they have actually received additional new funds from the client by explaining this process and eliminating those higher risk UnFavorable positions.
Click on Image to Enlarge
SIACharts.com specifically represents that it does not give investment advice or advocate the purchase or sale of any security or investment. None of the information contained in this website or document constitutes an offer to sell or the solicitation of an offer to buy any security or other investment or an offer to provide investment services of any kind. Neither SIACharts.com (FundCharts Inc.) nor its third party content providers shall be liable for any errors, inaccuracies or delays in content, or for any actions taken in reliance thereon.