Get Ready for 2014 with Proven Prospecting Techniques
By Brian Livingston, General Manager of SIACharts.com
With RSP season right around the corner, advisors should already be planning on how they are going to approach this upcoming year's huge opportunity for gathering assets. The question is, "What can I do to make the best out of this opportunity?" This article is not going to focus on how to go about finding clients, what types of clients to find, or how to become a more efficient advisor, as there are plenty of articles out there to help you figure out how to do that. Instead, this will focus on what you are actually presenting to your current clients to try to get more of their assets, or how you are going to convince new prospects to turn their assets over to you. With hundreds of planners and advisors using SIACharts to help manage and grow their book, we are in an excellent position to be able to see what is making them so successful, and what is separating them from others in the industry.
-
Take action. This is one thing that we cannot control but is by far the most important step to ever take. Having the best presentation in the world does not matter at all if you have no one to show it to. Get on the phone, send out some emails, whatever it is going to take to get your presentation in front of people.
-
Do you have a story to tell? What makes you different from the advisor that they are currently using? The team here at SIACharts have seen hundreds of websites, and read countless investing information documents, and one thing that we consistently see quoted is that advisors do their "due diligence" and say it like this is something that is unique. One would assume that an advisor should be doing this already as it kind of goes without saying. Saying that you manage risk is one thing, showing the potential client how you actually have a strategy and a powerful tool to mitigate risk is quite different.
-
Identify the Customers Problem and then Provide the Solution. Feedback we receive says that many people have been conditioned by their advisor to accept mediocrity, and that being in the markets means that you cannot avoid 50% drops sometimes. It is difficult to miss, if you shoot for the ground. The solution is to show them the pain that their portfolio is experiencing, and then show them that you have a rules based system that can help them manage their risk and their portfolio, thereby eliminating the pain. There are lots of potential clients out there who are just waiting for someone to show them that you have an answer to what happened in 2008 or past market drawdowns.
So, how do you go about creating the story? How do you eliminate the pain that prospects are feeling? More importantly, how do you get rid of the pain you could be feeling?
The rest of this article is now going to go through how advisors using SIACharts are successfully addressing these issues. As many of SIA's professional subscribers have stated, "We have never gathered assets this easily before."
Do You Have A Story To Tell?
2008 was an ugly year for the vast majority of advisors and also for their clients. It is now 5 years later and we are still over 10% off the all-time highs from the TSX Composite. That means that a lot of prospects out there are 5 years older and now have less money to retire on than they did 5 years ago. These people want to know that if a drawdown like 2008 happens again, that you have an answer for it. They no longer have the luxury of time that they may have had before and may be increasingly frustrated with their hard earned savings shrinking as they near retirement. The opportunity lies in the fact that most advisors have not changed their approach, and as a result, their clients are just as exposed as they were before to the next drawdown. Subscribers to SIACharts successfully answer this problem by having a Rules Based Macro to Micro Risk Management Solution.
Step 1: Equity Action Call

The Equity Action Call is SIACharts' leading indicator on how to buy and sell equities based on the strength between asset classes. This helps our clients know when to be approaching the purchase of Equity positions, whether it is actively, cautiously, or not at all.
Step 2: Asset Allocation Model
The Asset Allocation Model helps you narrow down where you should be focusing on making purchases by ranking the asset classes from strongest to weakest, generally on a 6 to 18 month go forward outlook. You can then allocate to the strength, rotate to different asset classes if the strength changes, and most importantly stay away from higher risk asset classes all together.
Using these two macro tools together allows you to be able to show prospects how SIA clients were standing on the sidelines well in advance of the crash in September of 2008, and how using these tools will help protect them in the future with a strategy to manage their risk.
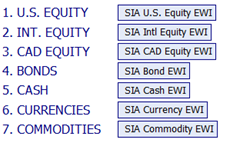
Step 3: Areas of Focus
![]()
Whether the prospect prefers stocks, ETFs, or mutual funds, all of our advisors are ready to quickly inform the prospect how their current holdings rank, using SIA's proprietary, unbiased, relative strength rankings. Realizing there is an opportunity cost of holding one investment over another, SIA clearly identifies investments with the highest relative strength and lowest risk that give you and your clients the best 6 to 18 month go forward outlook.
Reports
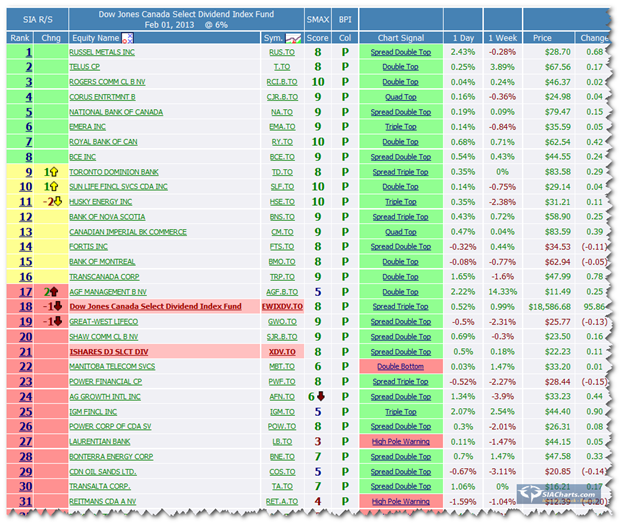
Regardless of what the prospect currently holds, not only can you show them how their investments rank compared to their peers, but you can also choose from hundreds of reports on the SIA system (or build your own custom portfolios) to then show what you would recommend instead. This process is a very powerful visual tool to show the prospect an unbiased viewpoint of the strength of their portfolio and more importantly the weaknesses that you would help them right away to upgrade to less risky investments based on the prospect's investment parameters.
Step 4: Model Tracking Performance
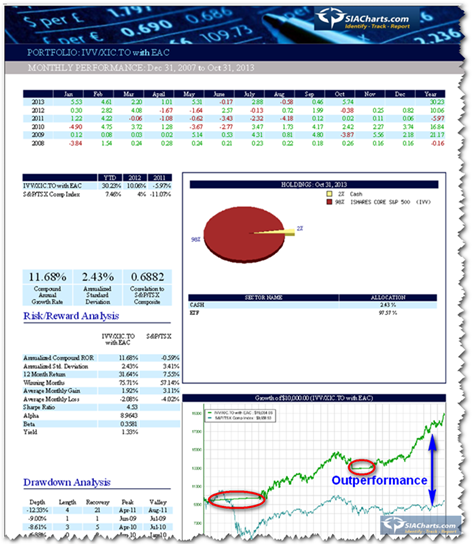
Above you can see the Red circles show how the SIA Equity Action Call adds value by staying away from equities at higher risk times and protecting against drawdowns while the blue arrow shows the potential relative outperformance of just using the Equity Action Call and SIA Asset Allocation rankings over the past 5 years over buying and holding the TSX Composite index, which is currently still in over a 5 year drawdown from the highs in June of 2008.
Using the historical calendar feature on any of SIA's Relative Strength reports, you can go back in time and make purchases to then create "back-tested" models to be able to show prospects how your strategies are performing or would have in the past. You can even enter in the prospect's holdings to compare their performance against your strategy on the same page. Once you have learned the SIA system a little bit, you can then go even one step further and set up what we call "models of models." This involves setting up a strategy for any of the asset classes you want to use, and then buying percentages of each model based on risk profile for each prospect. If you have those model baskets ready, you can then create a report like you see above in approximately a minute or two, regardless of risk profile. Why this is so powerful is that no matter what prospect walks in your door, you can quickly and effectively match their specific risk profile to a sample model tackling their concerns of risk management, drawdown protection, asset allocation, and your investment process in minutes!
Summary
Using a top-down approach from the macro market call of the Equity Action Call, to the Asset Allocation rankings, to the Sector rankings, to then making the individual investment selection, you can show your clients a rules based approach quickly and effectively. Tying that in with a model tracking portfolio that fits the prospect's risk profile at the end of the presentation to show relative outperformance, while emphasizing risk reduction throughout has helped our advisors gather millions and millions of dollars in new money, and build their client base. Subscribers who used to get nervous around $250,000 accounts are now closing million dollar plus accounts with confidence.
Every year advisors scramble around trying to gather assets, telling the same story each and every year. People are looking for and wanting a better way of having their assets handled, and subscribers to SIACharts are taking advantage of this. Maybe it's time to tell a new story and help relieve the pain that is out there, for both you and the prospect. Gather new money with confidence like you never have before!
Copyright © SIACharts.com