by Charts Etc.
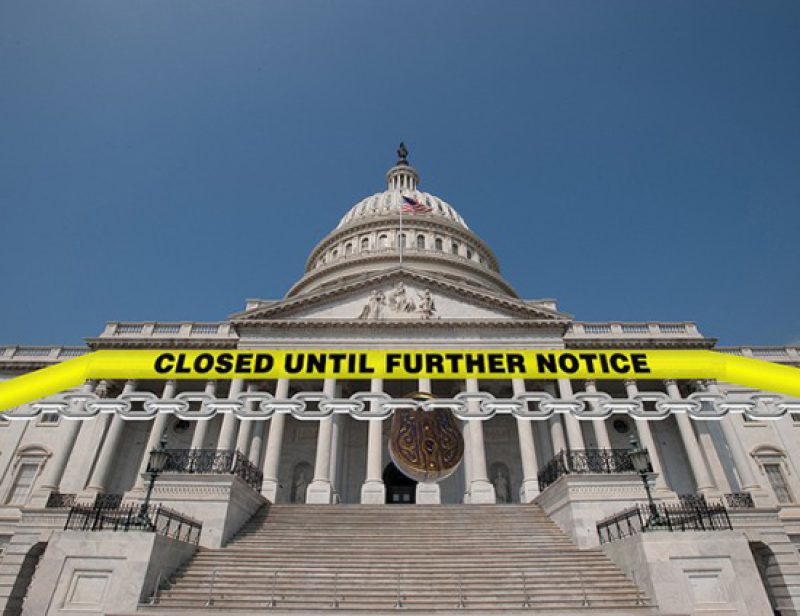
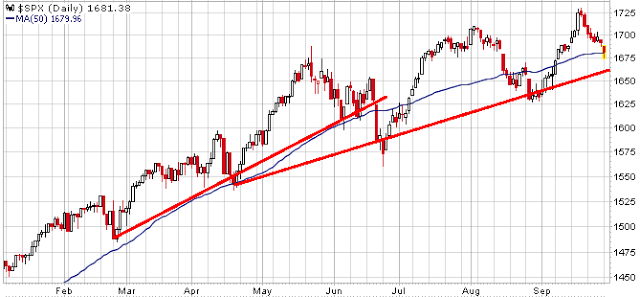
With this weekend's political outcomes concerning the budget, today the S&P 500 opened down about 1%, well below the 1690-1700 support area and currently resting just above the 50-day moving average.
Source: Stockcharts.com
Investors are concerned about an impending government shutdown and what it might do to an already fragile economic recovery. That said the S&P 500 futures reached a low of about 1670 pre-open in the early AM, with a bit of a rally ensuing, and the flatter Russell 2000 Index is not down as much (-0.2% vs. S&P 500's current -0.5%), inferring breadth is holding up comparatively. Note in the chart above that support exists at around 1670-1675 near the prior highs in May, and then at around 1660-1665 with the rising trend line.
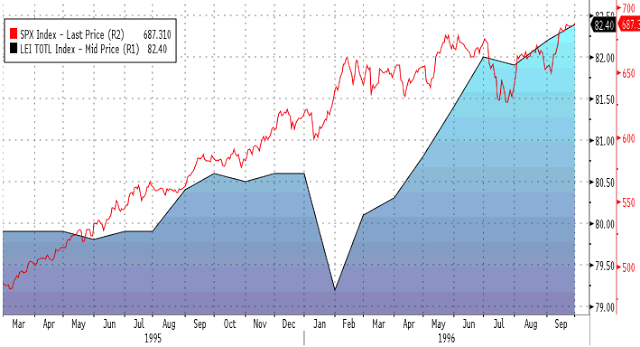
Many may forget what happened in late 1995 into January 1996, the last time the government shut down.
Source: Bloomberg
The chart above shows the S&P 500 at that time along with the Conference Board US Leading Economic Indicators Index (blue shade). The market took everything in stride, suffering a few minor declines during the shut downs but never putting the uptrend in jeopardy. This despite the brief plunge in the LEI at the start of 1996, with the S&P 500 then lifting off to a new high, further suggesting investors were (correctly) looking through this near-term potential calamity.
And below is what such a chart looks like from 2012 to date.
Source: Bloomberg
The LEI has been steadily rising since late last year, showing no signs of weakness, and the S&P 500 has remained in a nice uptrend during this time. Unless Congress is dead set on wreaking havoc with a protracted shut down, one that will drag on for many months and likely plunge the country back into a deep recession, I have to think investors will once again -- as in 1995-1996 -- discount the worst-case scenario fairly quickly and this recent market decline should be temporary.
Some have even pointed out that the US sovereign CDS spread has spiked of late, reflecting real and growing investor nervousness.

Source: Bloomberg
However, as shown in the chart above, this CDS spread has been much higher in the recent past, making this latest pop higher not much to get worked up over.
During times like this, it pays to maintain perspective and not get caught up in the hysteria being blared by CNBC and the media. Remain calm, think rationally and use history as a guide -- all of which will always serve one well when managing financial assets. And yes it may be different this time, but most of the time it's not.
Copyright © Charts Etc.


