Upcoming US Events for Today:
- Case-Shiller House Price Index for June will be released at 9:00am. The market expects a year-over-year increase of 12.2%, consistent with the increase reported previous.
- Consumer Confidence for August will be released at 10:00am. The market expects 78.0 versus 80.3 previous.
- Richmond Fed Manufacturing Index for August will be released at 10:00am. The market expects 0 versus -11 previous.
Upcoming International Events for Today:
- German Economic Sentiment for August will be released at 4:00am EST. The market expects 107 versus 106.2 previous. Current conditions is expected to show 111 versus 110.1 previous.
The Markets
Stocks sold off on Monday, weighed down by concerns related to Syria and a downbeat report on durable goods orders for the month of July. The S&P 500 declined by four tenths of a percent, ending once again below the 50-day moving average, which now sits at 1660. Flipping to the hourly chart of the large-cap index, momentum indicators are back on a sell signal with stochastics charting a bearish crossover and MACD about to cross the signal line. Short-term negative pressures remain intact and a break below 1639 will confirm a lower intermediate high on the daily chart. For now the trend remains negative on a short-term scale, but an intermediate scale negative trend is directly around the corner. Next level to watch is the 100-day moving average, presently trading at 1636. This longer-term moving average supported the market back in June, providing ideal buying opportunities leading into the typical summer rally period. The benchmark may not be as fortunate this time around to find support at this significant moving average. Seasonal weakness and volatility increase from here through to October.
The ratio of stocks versus bonds is giving indication that an intermediate risk off period is upon us. Using the ratio of the S&P 500 ETF (SPY) and the Barclays Aggregate Bond Fund (AGG) to gauge the relative strength of the two markets (stocks versus bonds), the 4-week moving average of the pair has just crossed below the 7-week average, an event that has typically led to corrective periods in the stock market. The Aggregate Bond Fund (AGG) is suggesting a double-bottom pattern around $105.50 and momentum indicators are positively diverging from the intermediate price activity, indicating fading selling pressures. The fund may be poised for a move higher from this apparent level of support, benefitting from equity market volatility over the weeks ahead.
Seasonal charts of companies reporting earnings today:
Sentiment on Monday, as gauged by the put-call ratio, ended bullish at 0.90.
S&P 500 Index
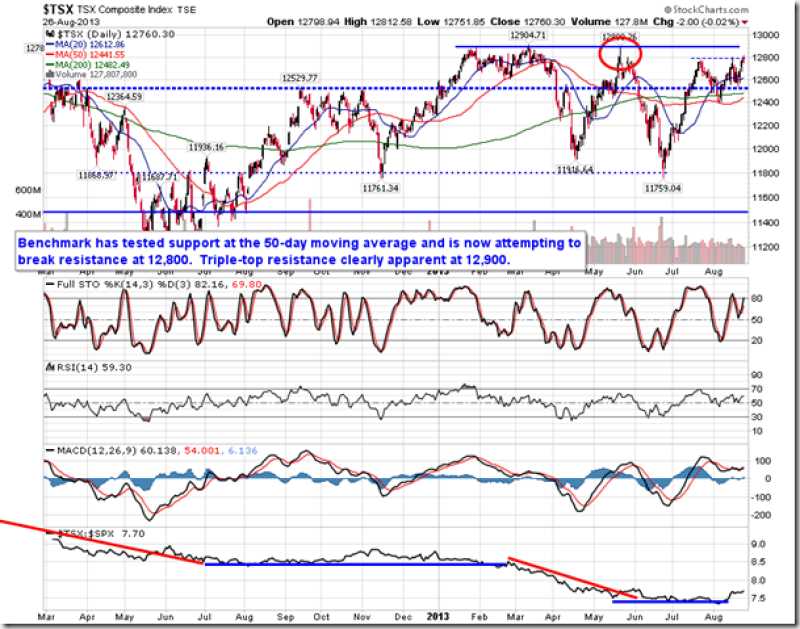
TSE Composite
Horizons Seasonal Rotation ETF (TSX:HAC)
- Closing Market Value: $13.74 (unchanged)
- Closing NAV/Unit: $13.75 (up 0.29%)
Performance*
| 2013 Year-to-Date | Since Inception (Nov 19, 2009) | |
| HAC.TO | 8.12% | 37.5% |
* performance calculated on Closing NAV/Unit as provided by custodian
Click Here to learn more about the proprietary, seasonal rotation investment strategy developed by research analysts Don Vialoux, Brooke Thackray, and Jon Vialoux.


