by James Paulsen, Chief Investment Strategist, Wells Capital Management
Debunking the Great Fed Myth
The Federal Reserve’s unconventional and massive quantitative easing (QE) campaign has produced a widespread belief that both the economy and the stock market simply represent a sugar high which will abruptly end as soon as the Fed begins tapering. Since slower monetary accommodation appears to be forthcoming, we may soon find out whether anxieties surrounding the Fed are indeed fact or fiction. That is, for the next several months, both the economy and the financial markets will attempt to debunk the Great Fed Myth.
This is not an idle debate. Should the economy be unable to stand on its own two feet, private sector confidence among both businesses and households would be shaken and renewed economic fears would likely challenge the stock market. Alternatively, should the economy and the stock market survive and prosper despite the Fed taking away the punch bowl and despite higher mortgage yields, “confidence” (possibly held back by a Fed which perpetuated a “myth” that the economic recovery was artificial and only being kept alive by a constant liquidity drip) may finally improve enough to produce economic activity based on animal spirits and promote yet another upward valuation reassessment in the stock market.
Effectiveness of QE?
Federal Reserve policies implemented immediately after the 2008 collapse were absolutely instrumental in returning the economy to recovery. However, the favorable economic and financial market impacts of QE operations are probably overstated.
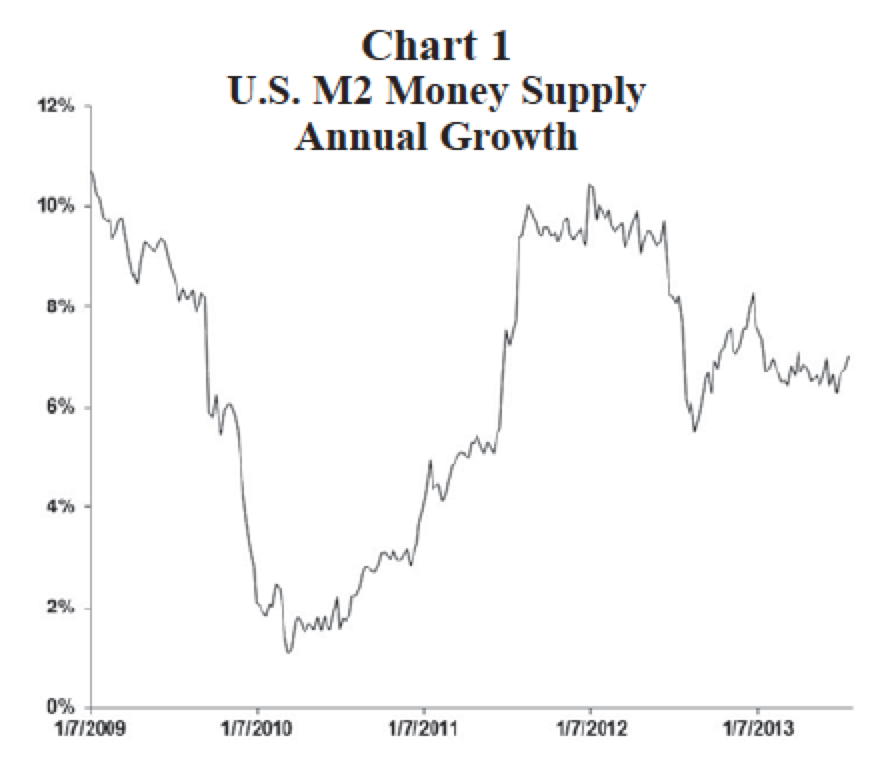
First, as shown in Chart 1, massive doses of QE have done little to alter the growth of the money supply. Despite an unprecedented ballooning in the Fed’s balance sheet to almost $3.5 trillion, annual growth in the M2 money supply has remained range-bound since the QE program began. Essentially, QE has been unable to reach the economy. Rather, its potential impact has been thwarted by a surge in “excess” bank reserves which have never left the Federal Reserve. What good is a several trillion dollar rise in “excess reserves” if they never leave the building?
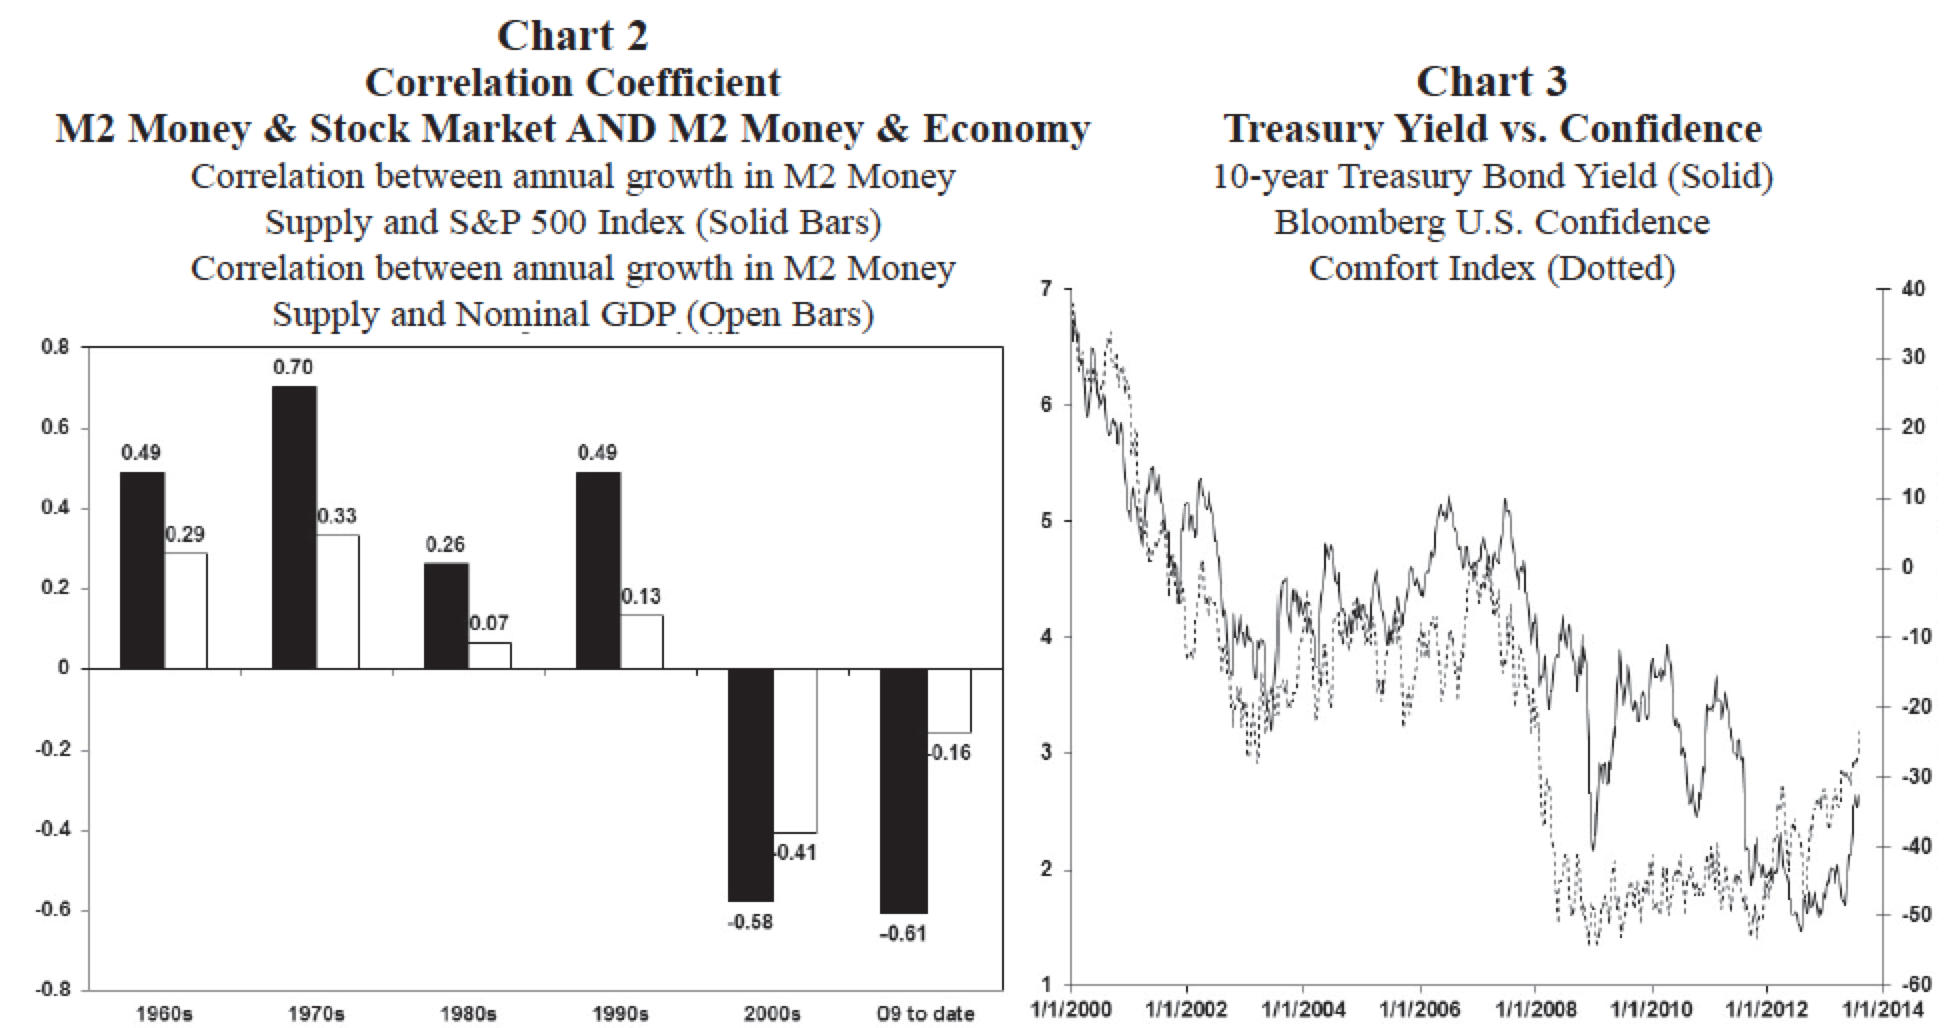
Second, as illustrated in Chart 2, monetary policy has been far less effective in recent years. Historically, growth in the money supply has been positively correlated with both nominal GDP and the stock market. However, since 2000 (and noticeable in this recovery), money velocity has irregularly declined causing the relationship and importance of monetary policy to become much more questionable.
Finally, even if velocity keeps declining and banks are not lending excess reserves, many believe QE bond purchases have at least kept mortgage yields low helping to revive the housing industry. This, however, is also dubious. As suggested in Chart 3, perhaps it was a lack of confidence rather than QE keeping yields low. Fear has been the bond market’s best friend since 2000 and particularly since the 2008 crisis. Were Fed bond purchases really required to keep yields lower after the eurozone crisis emerged or after the U.S. government lost its Aaa bond rating? Didn’t the quest for a safe haven as Armageddon fears gripped investor mindsets push yields lower? And, as suggested by this chart, have yields been rising in recent months because most fear tapering is nearing or is it because confidence has finally been improving? This chart strongly suggests it is confidence and not the Fed which has been managing bond yields.
Could monetary policy and the unprecedented QE program have played a much smaller role in the economy and the financial markets than most perceive? If so, may the Fed’s exit strategy prove far less dramatic than feared?
So far, so good... Economy
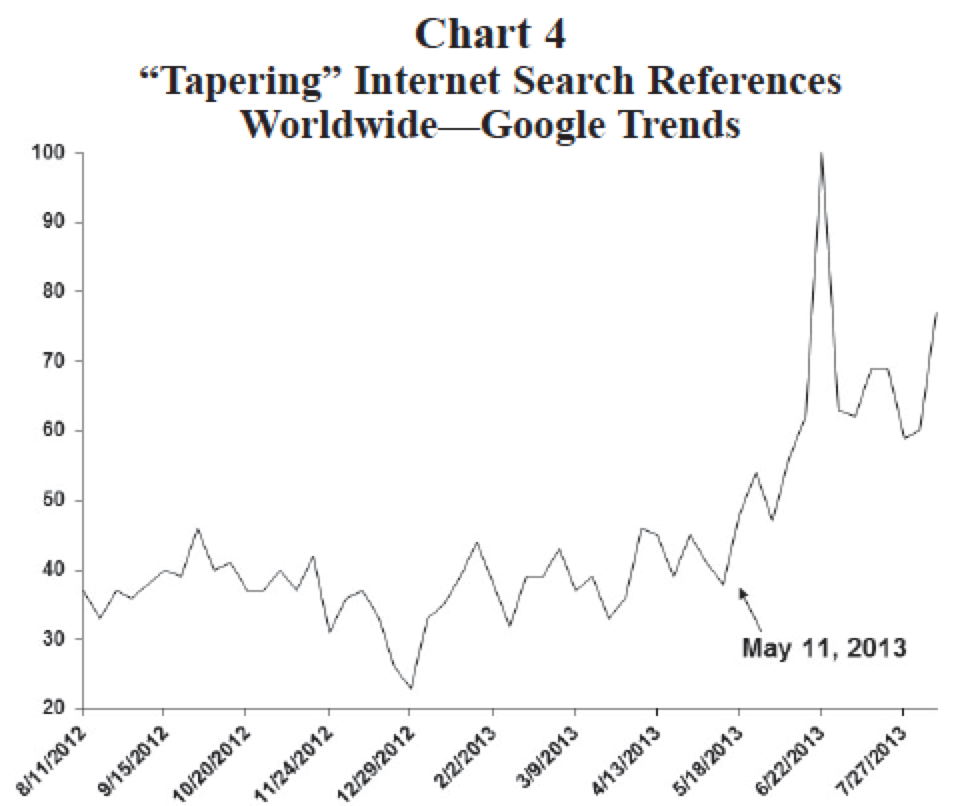
Chart 4 shows internet activity referencing the word “tapering” exploded in early May suggesting the debate surrounding the Fed’s exit strategy began about three months ago. During the balance of this year, we suspect the financial markets will be primarily driven by debunking or by not debunking “the Great Fed Myth.” Ultimately, this question will be decided by the performance of both the economy and the financial markets.
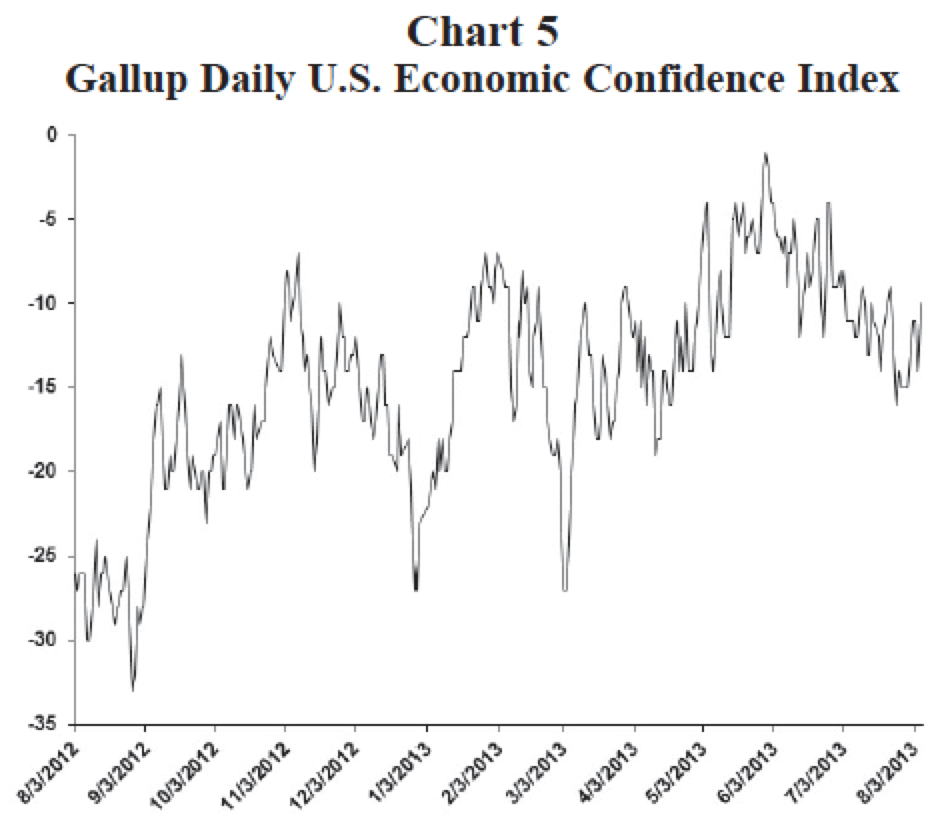
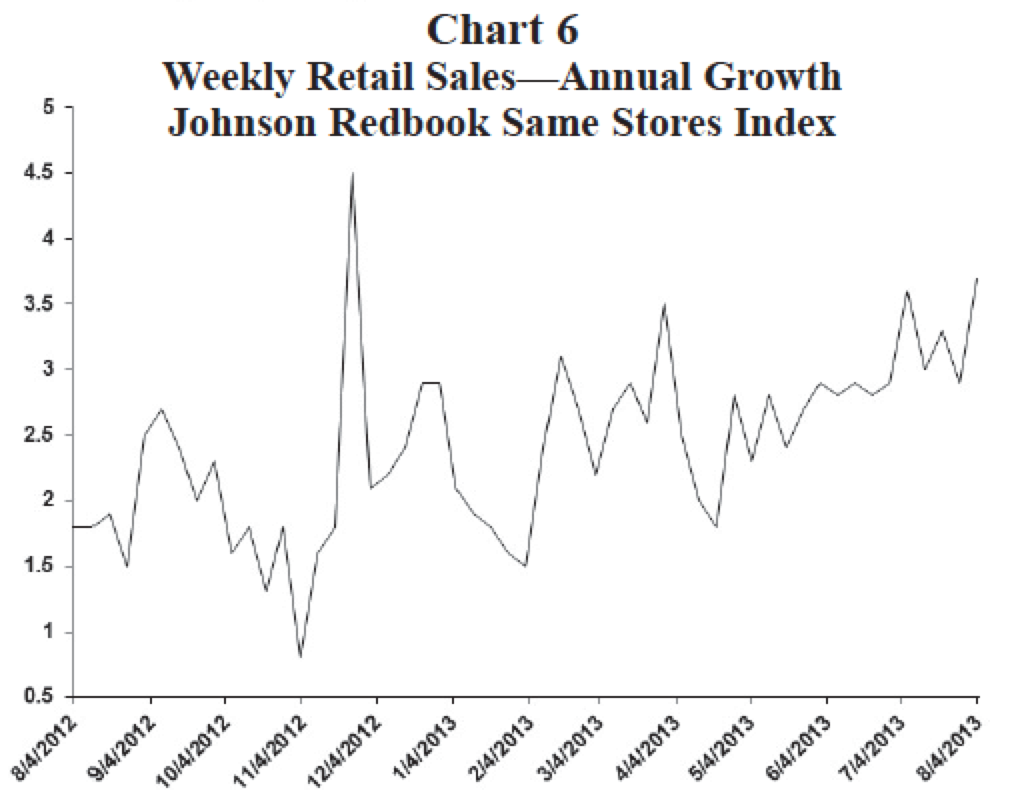
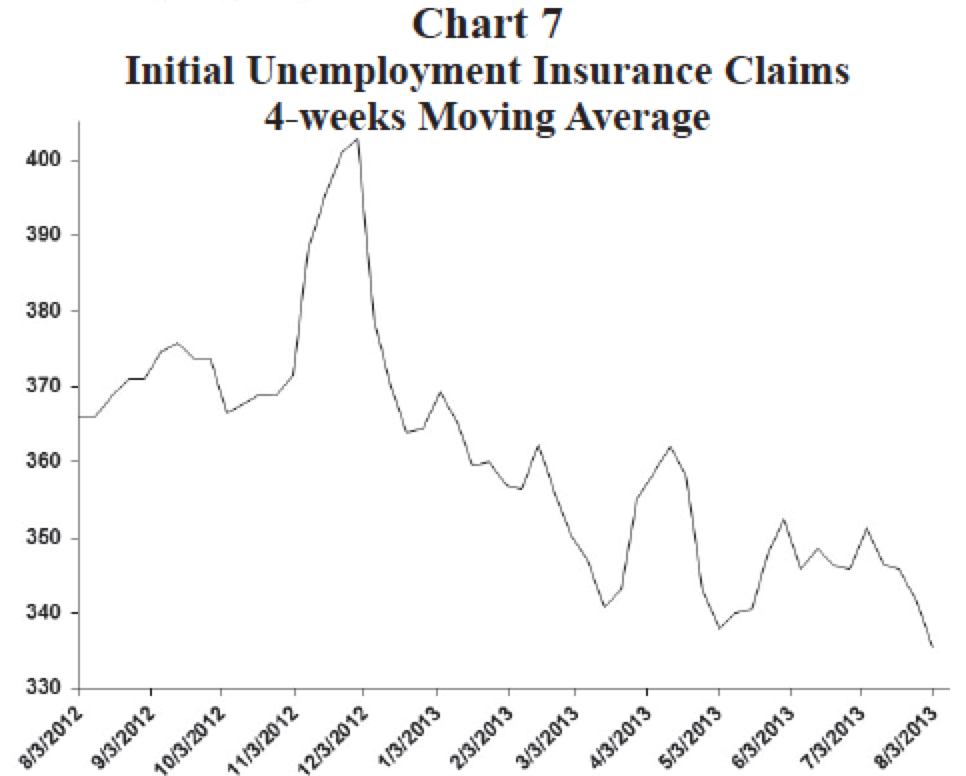
So far, so good! A daily Gallup poll measuring economic confidence (Chart 5), while off from its peak in May, has held up remarkably well, despite much higher mortgage yields and broadening discussions suggesting the Fed will soon begin to taper. Since May, the job market (Chart 6) has continued to improve as highlighted by the lowest reading of the recovery in the four-week average of jobless claims. Weekly retail trends also seem to be little impacted thus far by tapering talk or higher yields. Chart 7 shows samestore retail sales have improved since May recently reaching the strongest growth performance the year.
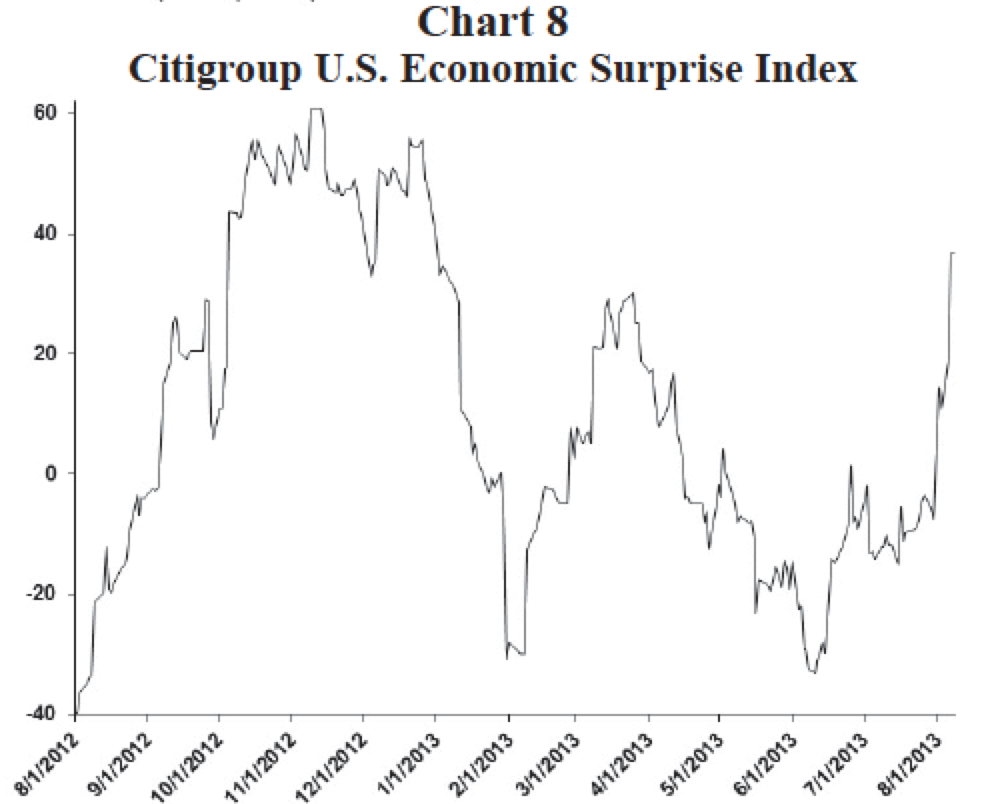
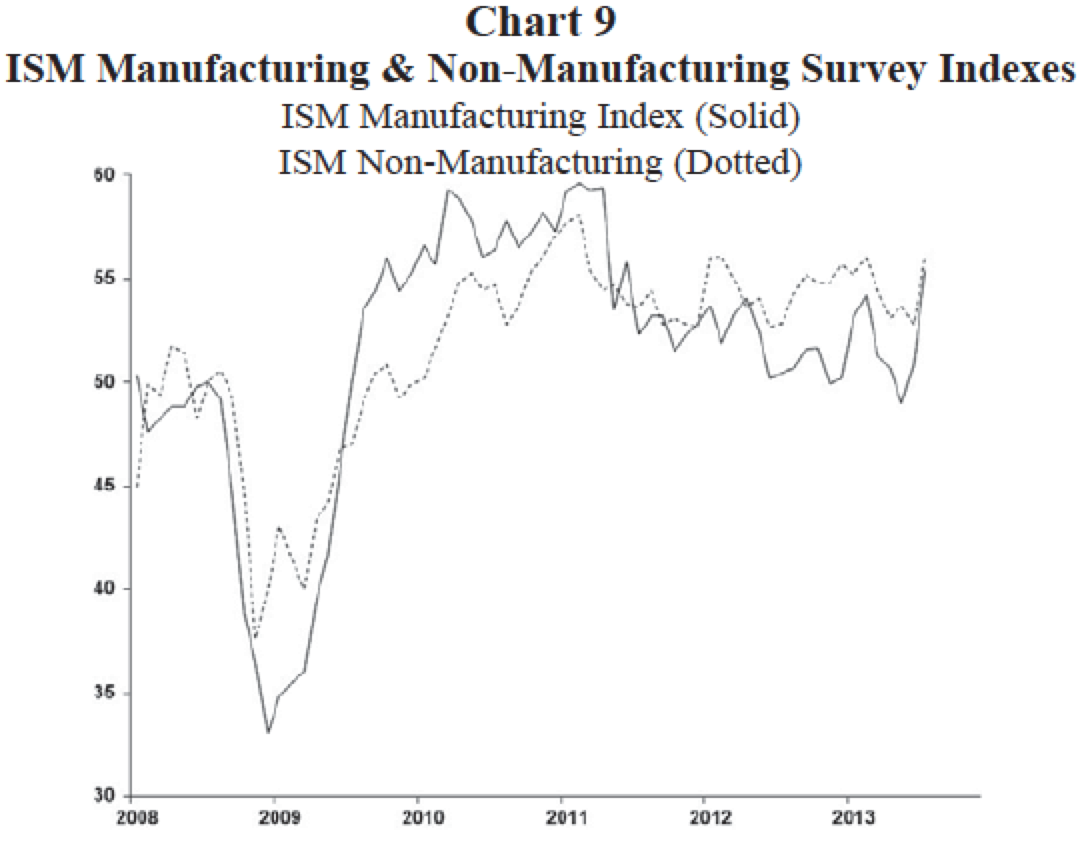
Since June, as shown by Chart 8, overall economic reports have outpaced expectations with increasing frequency. The Citigroup U.S. Economic Surprise Index just reached its highest level since last year! Finally, after being absent for most of this year, the U.S. finally appears to be regaining manufacturing activity (Chart 9). The ISM manufacturing survey index (which was in contraction below 50 in April) exploded to 55.4 in July, its highest level in more than two years!
So far at least, despite a “taper craze” and a surge in long-term bond yields, most timely economic indicators suggest resiliency and a recovery which appears increasingly sustainable.
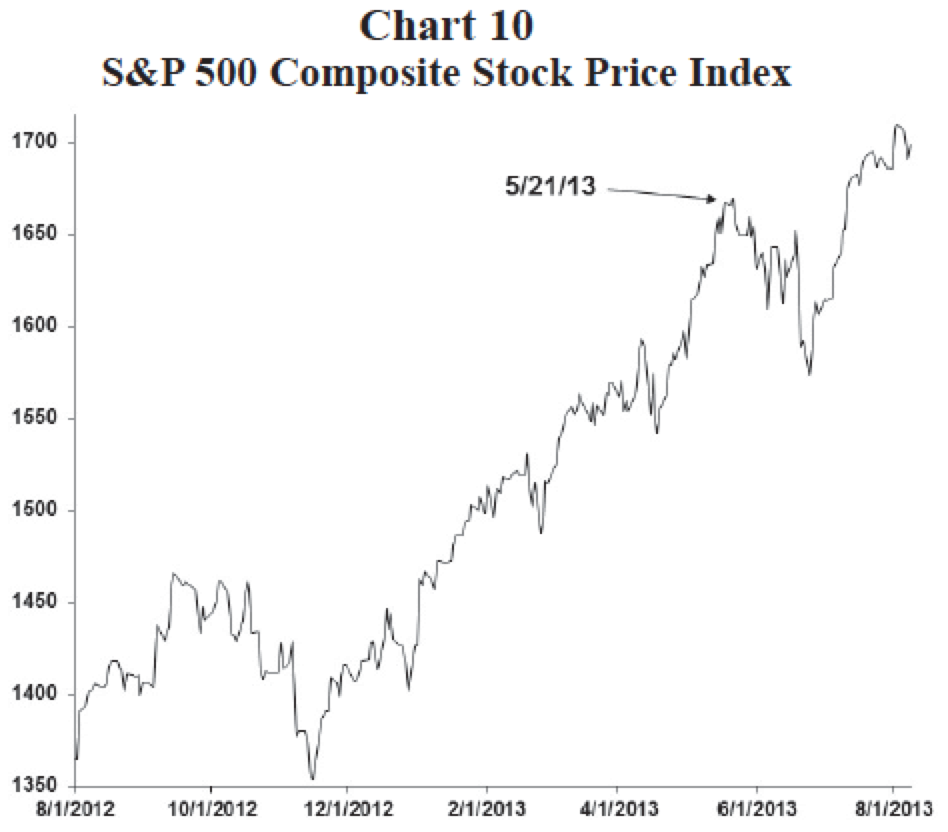
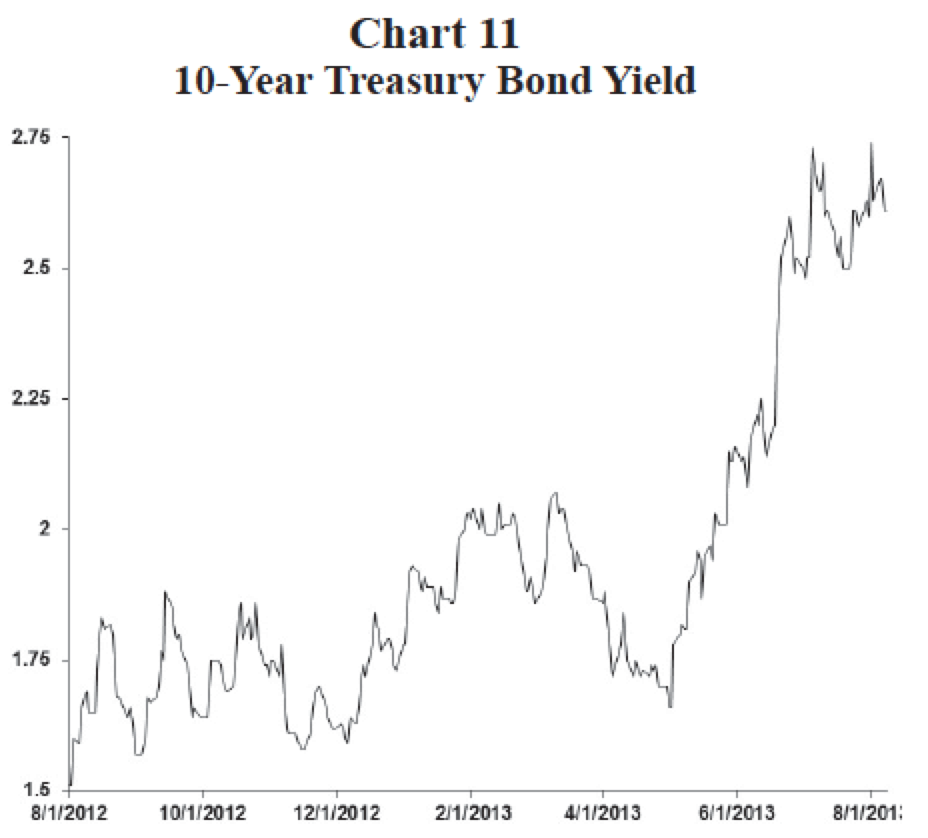
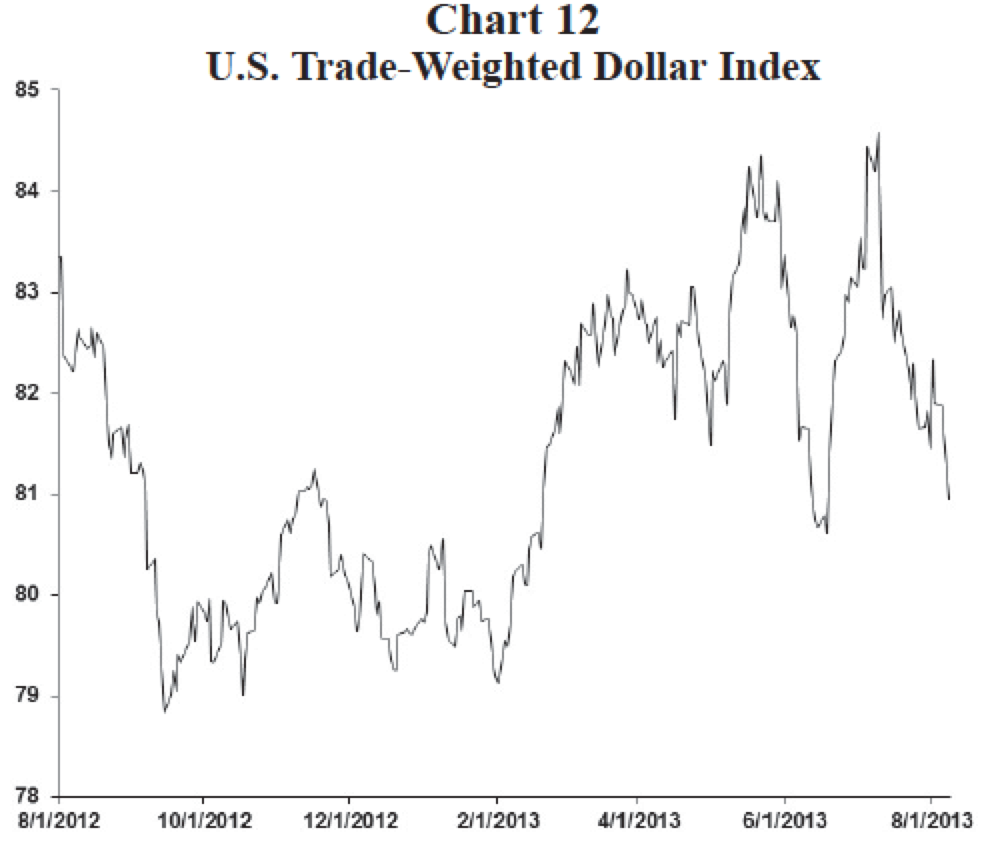
So far, so good... Financial markets Most financial market indicators also suggest tapering and higher bond yields may not be the death blow many predicted. The S&P 500 Index (Chart 10) did suffer an initial pullback as tapering fears first intensified but has subsequently recovered to new all-time highs above 1700. The 10-year bond yield (Chart 11) has not retraced hardly any of its recent surge. Both the stock market and the economy seem to be doing fine with mortgage yields about 1% higher and consequently not even ongoing massive bond buying by the Fed has succeeded in lowing yields again. Expectations of Fed tapering and higher bond yields have also not yet pressured the economy by pushing the U.S. dollar higher (Chart 12). Indeed, while the U.S. dollar index did initially surge when taper talk surfaced, it has subsequently declined below where it was earlier this year when bond yields were much lower.
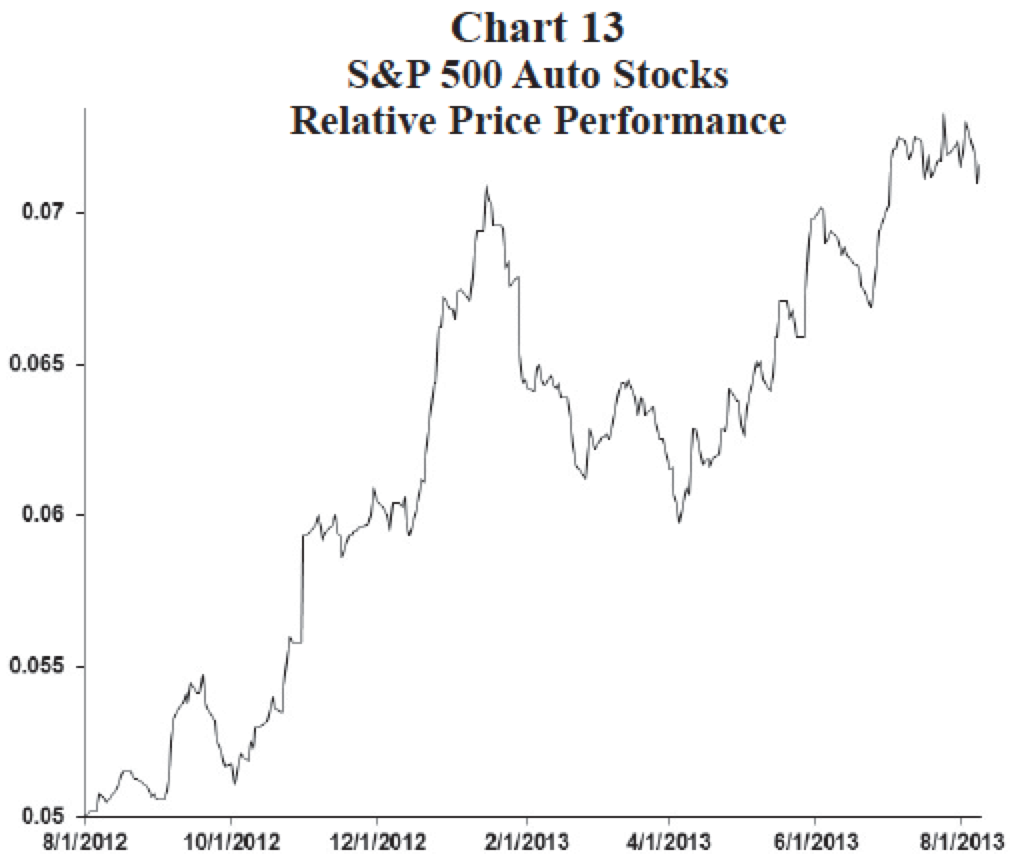
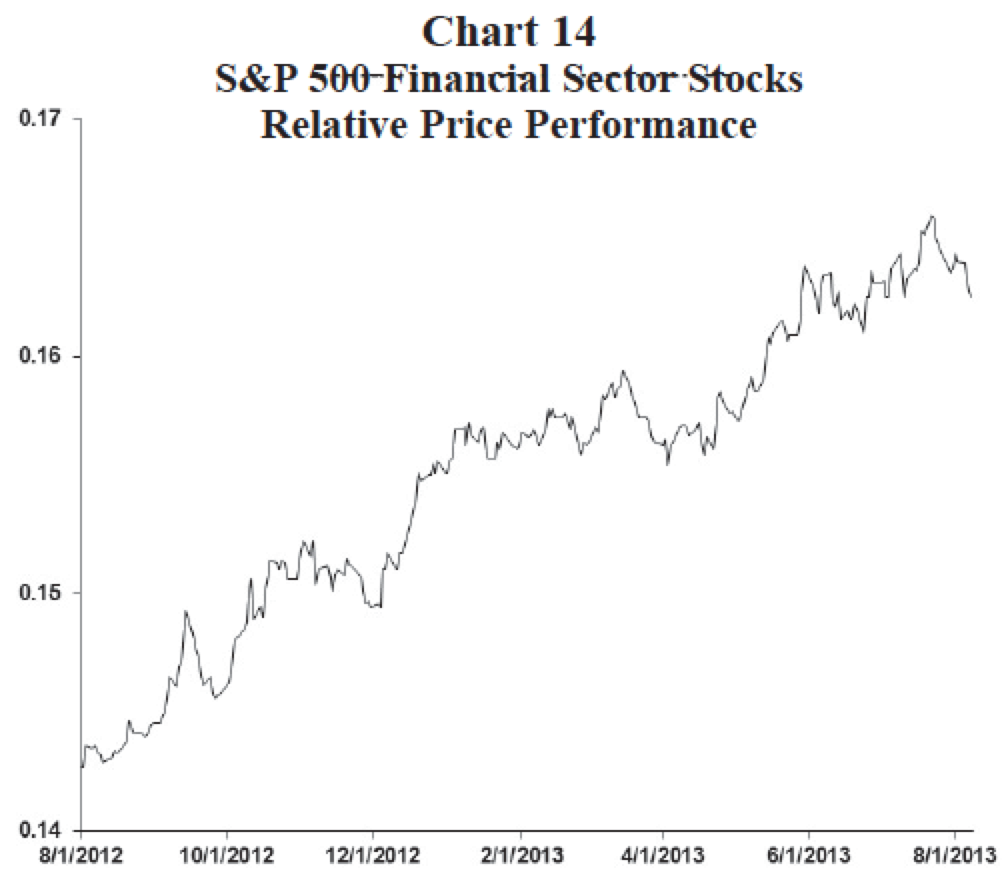
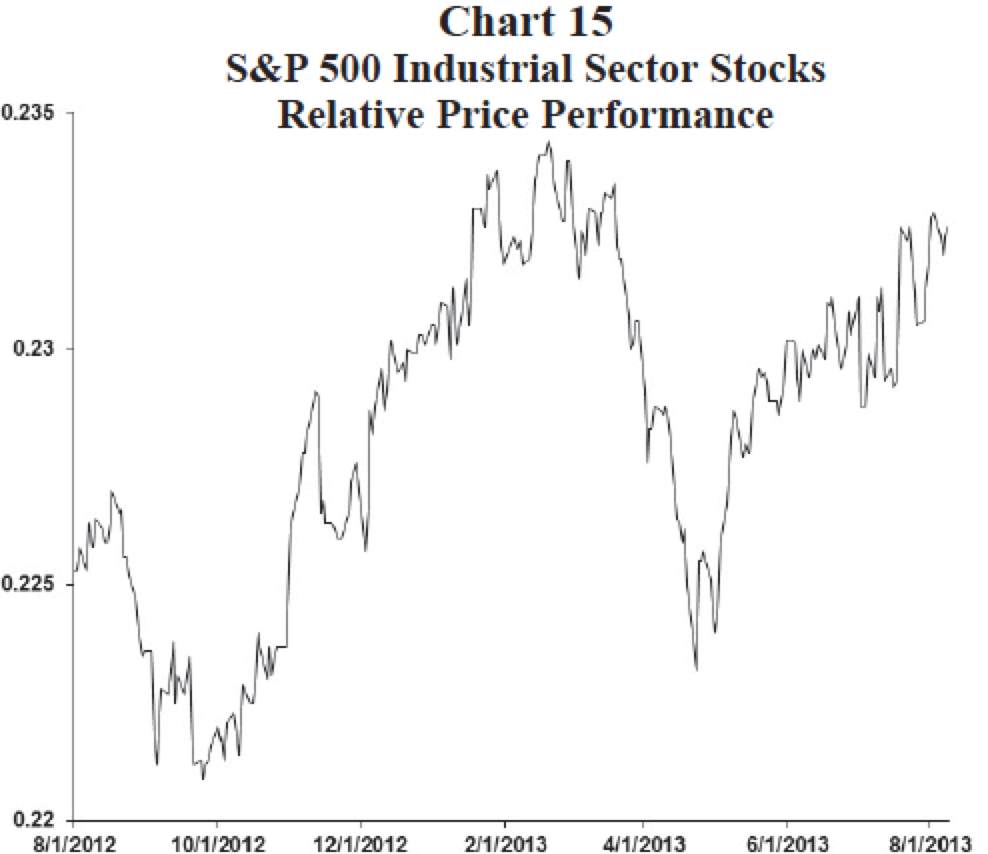
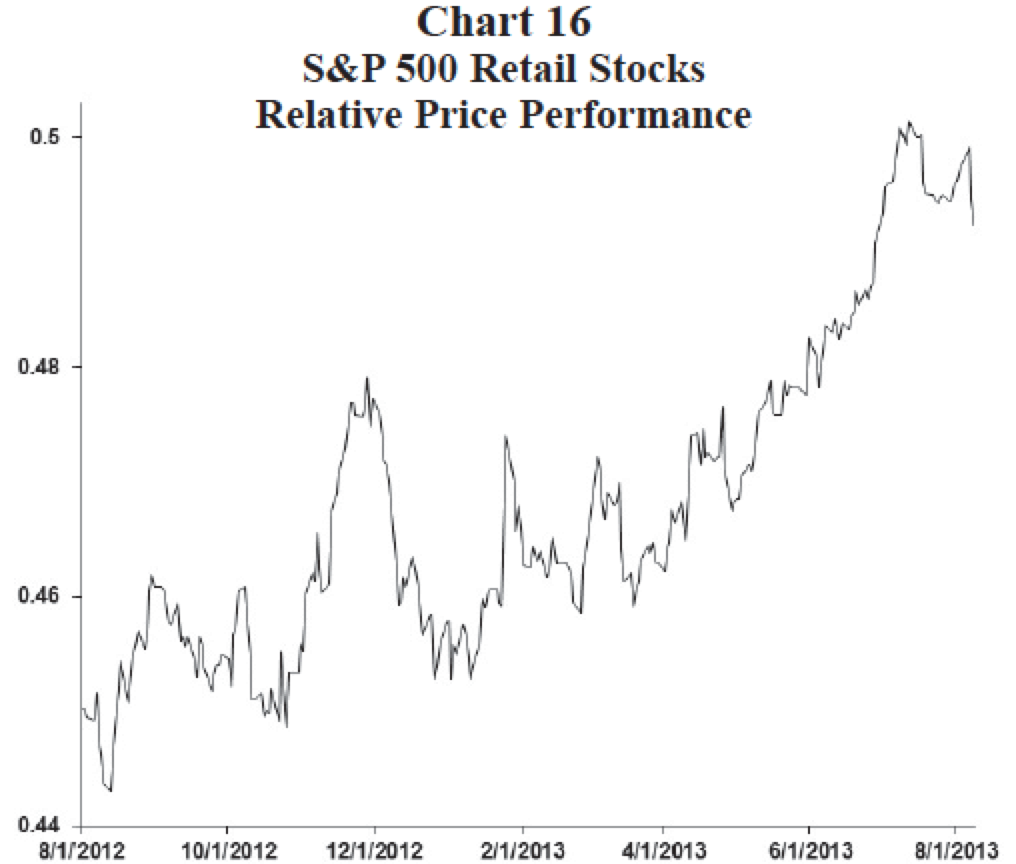
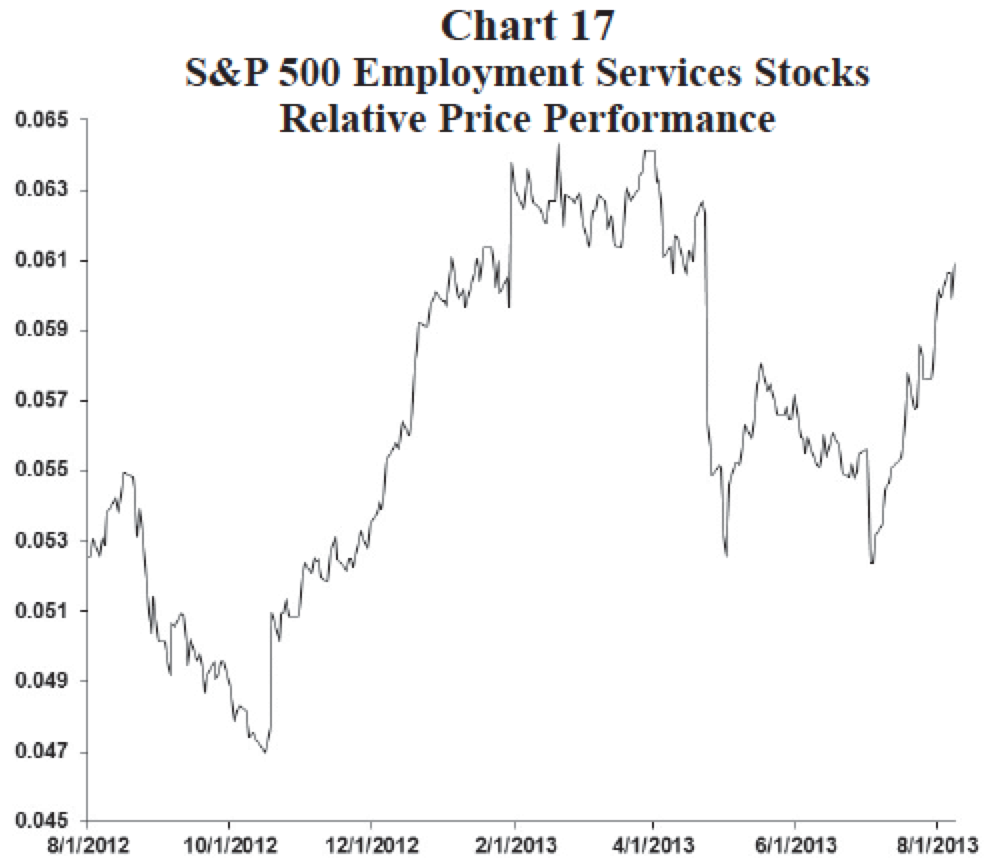
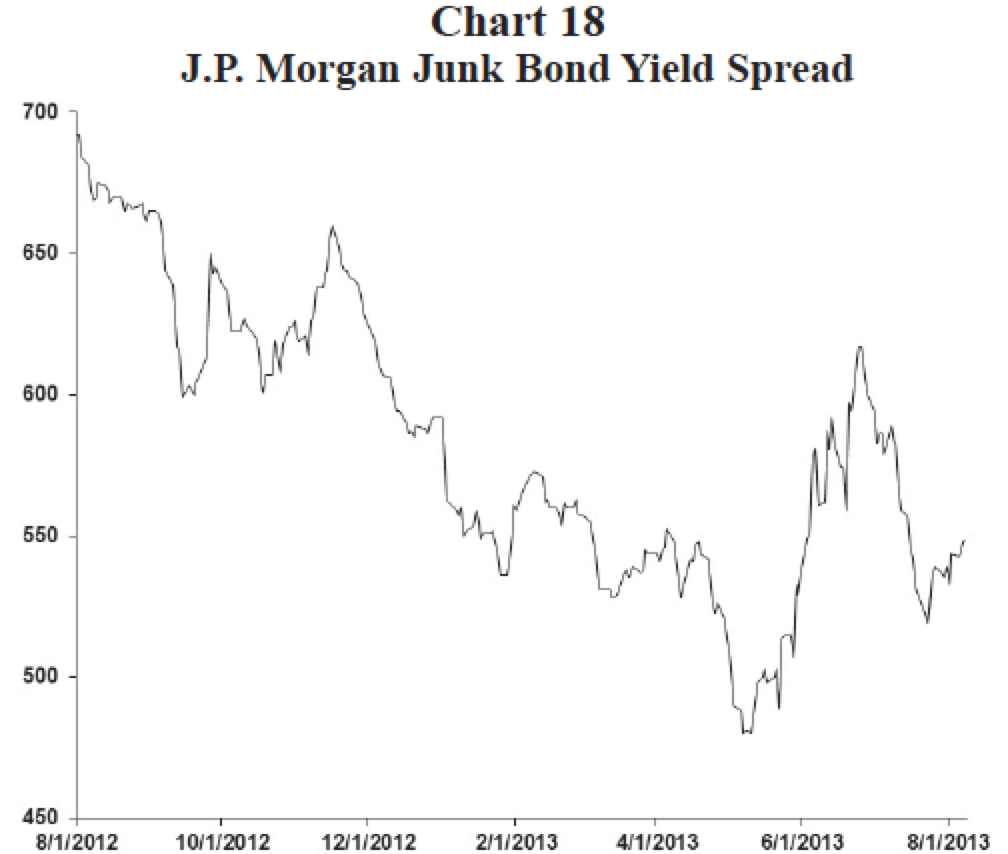
Finally, as illustrated by Charts 13 through 18, the stock market continues to be led by a number of economically sensitive sectors. The diversity of stock market sector leadership spans the cyclical economy including the big ticket auto industry, industrial stocks, financial stocks, employment services stocks, and retail stocks. The bond market’s assessment of credit risk has also not been much affected by taper talk. Junk bond yield spreads did initially spike last May (Chart 18) but have subsequently returned to levels seen prior to the recent surge in bond yields. Broadly based cyclical stock price leadership and sanguine credit market spreads suggest rising expectations of Fed tapering and higher bond yields have yet to break ongoing momentum in the economy.
The “debunking debate” will continue
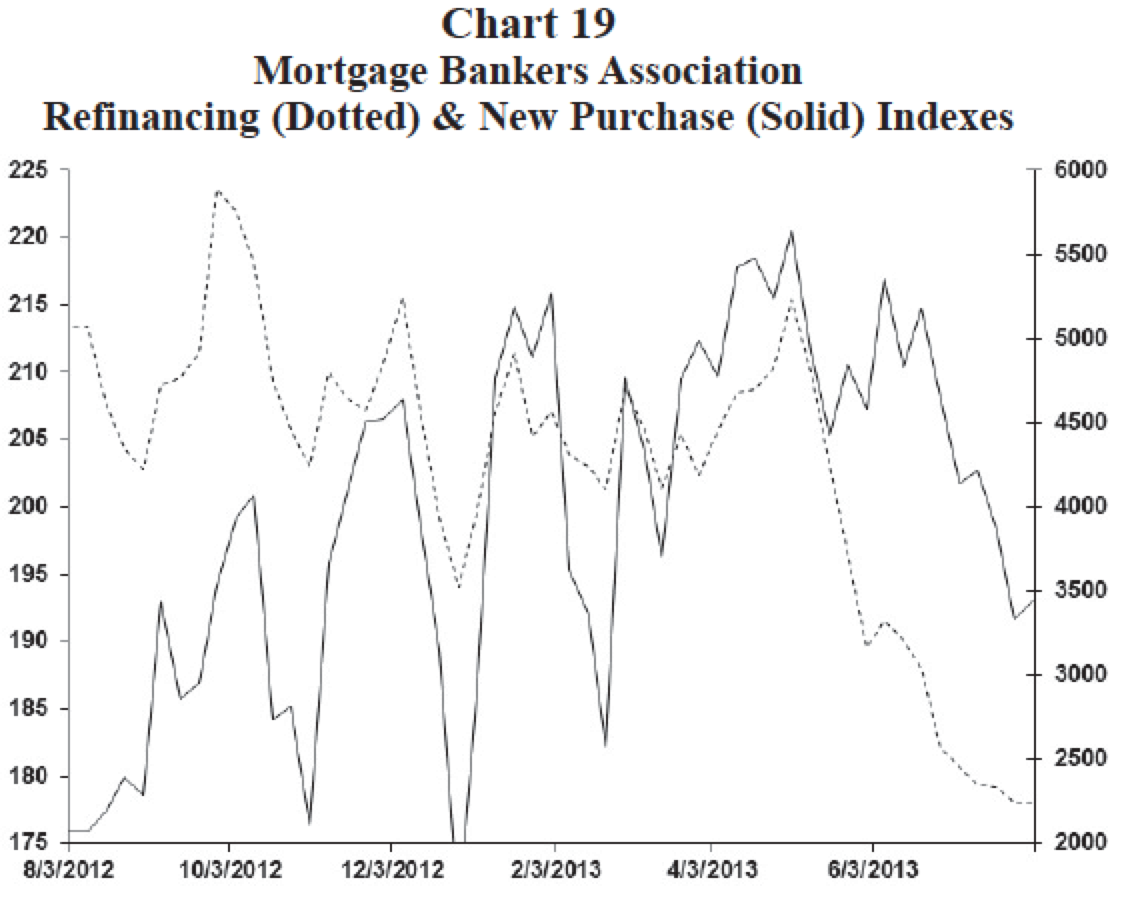
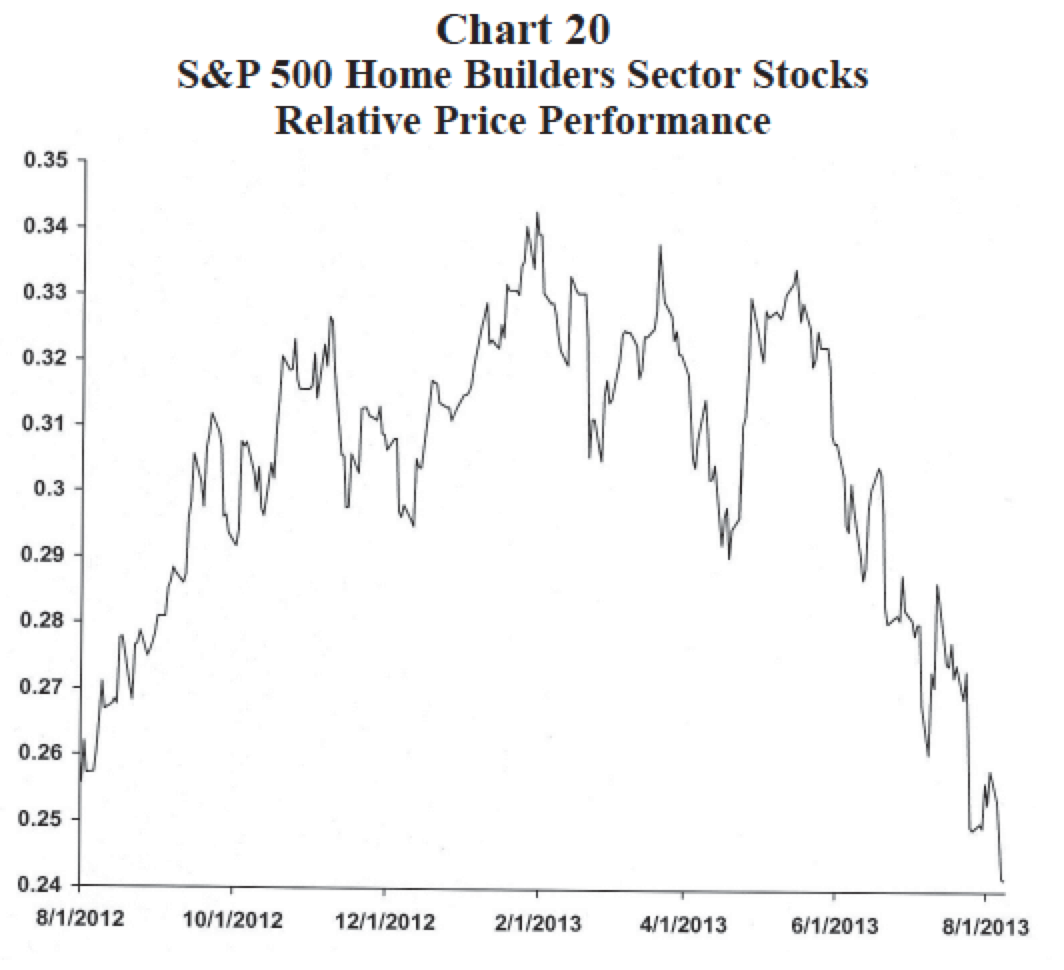
It is still early, but the economy and the financial markets seem to be managing a potential Fed exit and much higher bond yields in stride. However, this debate will not likely be settled without consternation. We fully anticipate some economic anxieties and financial market volatility during the rest of this year. Already, higher mortgage rates are impacting the housing industry. Chart 19 illustrates that both refinancing and purchase applications for home mortgages have waned as interest rates have risen. Moreover, the relative performance of homebuilder stocks (Chart 20) has collapsed since tapering talk first surfaced in May.
We expect real GDP growth to average about 3% in the second half of this year. That is, economic growth should remain strong enough to prevent the stock market from declining significantly but ongoing worries surrounding the Fed’s exit strategy and another upward leg this year in bond yields (we suspect the 10-year bond yield will reach 3% before the year is over) should also keep the stock market from rising much further. Overall, our guess is the S&P 500 index ranges between about 1575 and about 1725 during the balance of 2013.
Economy stands on its own?
Although the stock market is currently digesting changes which may cause it to trend sideways for a time (a 3 point rise in the price-earnings valuation on stocks since last year, a major upward re-pricing in bond yields, and an imminent start to Fed tapering), we do not believe the bull market has ended. Indeed, a resolution to the very thing which is causing so much anxiety today (Fed tapering) may be the primary catalyst driving stocks higher again next year.
If Fed tapering begins in September and both the economy and the stock market do not fall apart as many fear, “confidence” as we enter 2014 could be boosted as the economic recovery is finally perceived as standing on its own! Could “debunking the Great Fed Myth” prove more stimulative for the economy and the stock market than was QE?
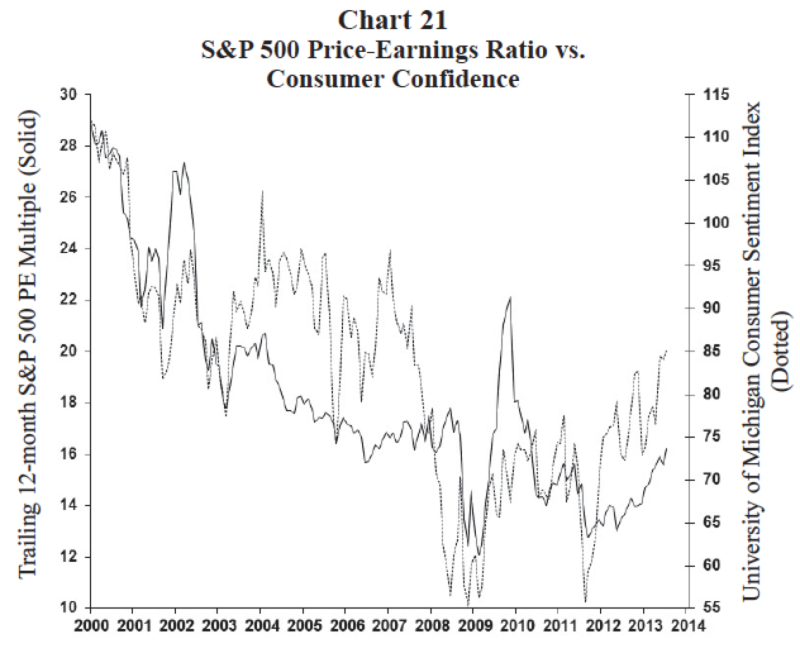
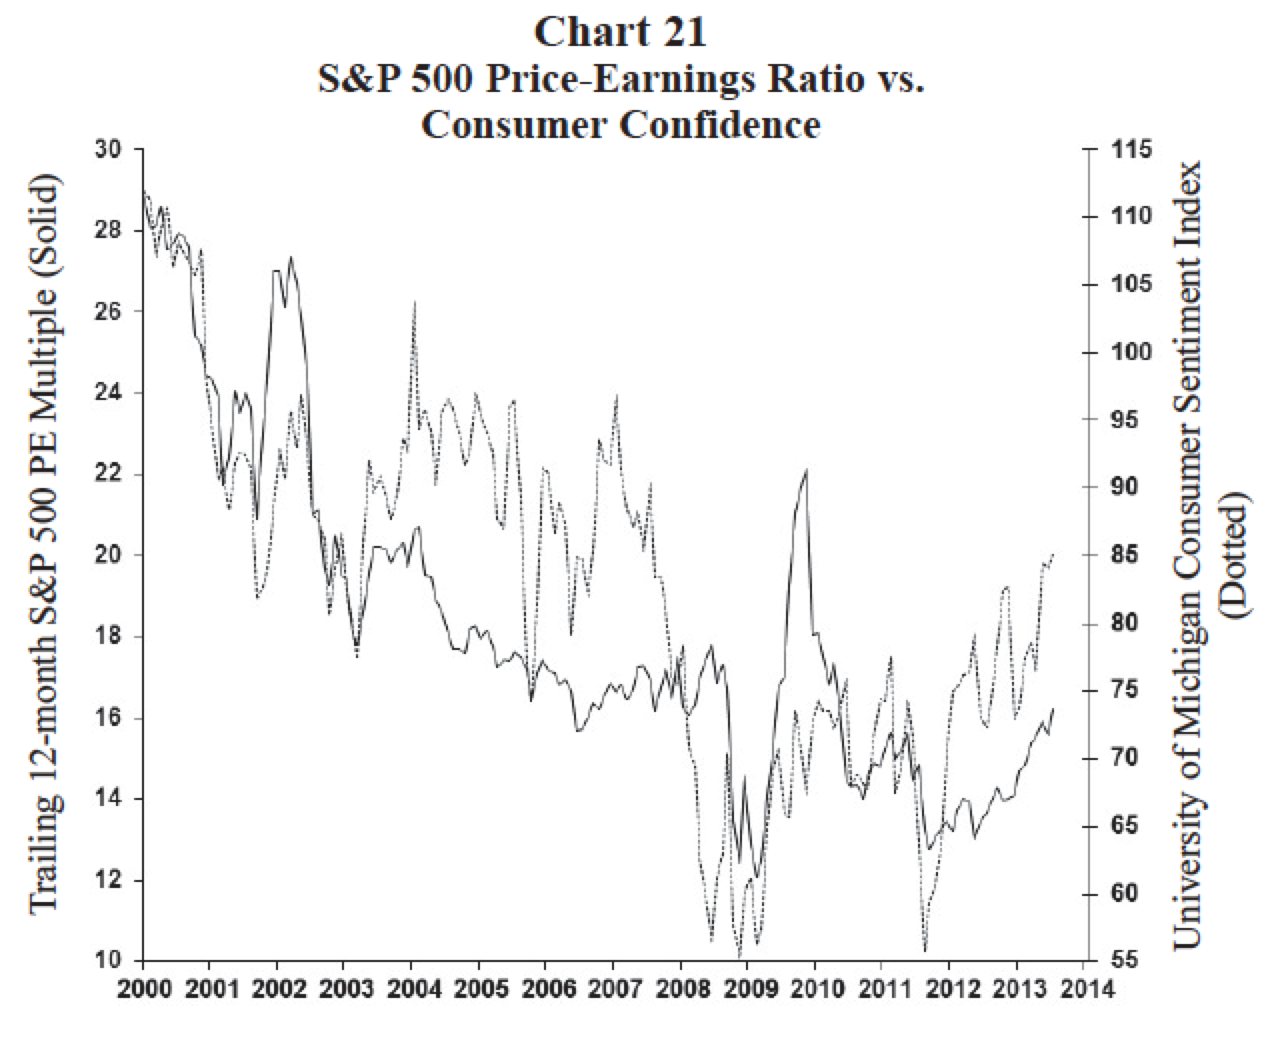
Chart 21 highlights the potential payoff which could come from winding down QE. It overlays the trailing price-earnings (PE) multiple on the S&P 500 Index with an index of consumer confidence. PE multiples have mostly declined since 2000 in line with a slow but steady erosion in economic confidence. While fear has been the best friend of the bond market, it has proved the stock market’s worst enemy.
This has started to change! Confidence bottomed during the U.S. government ratings disaster in 2011 and has since been slowly recovering. Indeed, confidence improved even further since last year as economic performance broadened (housing activity surfaced and the unemployment rate began a steady decline) and as the U.S. economy proved it could drive right over the fiscal cliff and just keep trucking (i.e., the economy proved it was much more resilient than feared). Most importantly for stock investors, PE multiples have followed this slow recovery in confidence. Indeed, the recovery in the S&P 500 PE multiple since early-2012 represents the “first” significant rise in the stock market’s valuation since at least 2000 which was not caused by a drop in earnings (i.e., the increase in the PE multiple during 2001 and 2009 were mainly the result of falling earnings rather than higher values).
In our view, the driving force behind the stock market run since last year was not the Fed’s QE operations, nor earnings growth and certainly not falling bond yields. Rather, it has been rising confidence! How much more could confidence (and therefore PE multiples) be boosted again in 2014 by the “end of QE” and a growing belief the economic recovery is finally standing on its own two feet? Perhaps the stock market and the economy will drive right through the “Great Fed Myth” just as they drove right over the “Great Fiscal Cliff.”
Copyright © Wells Capital Management


