by Tom Brakke, Research Puzzle
going negative

The previous posting showed the rate of change for the S&P 500 over a couple of time frames. This one goes back to that concept, now in the realm of fixed income.
It was triggered by a discussion with a reader (whose birthday happens to be today) who noted that twelve-month total returns on bond funds are starting to turn negative. She commented that seeing that on an account statement has been unusual — and might provoke a reaction from a holder of the funds.
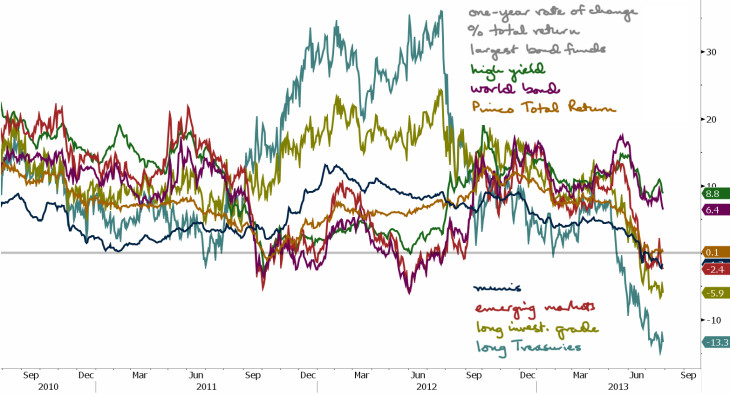
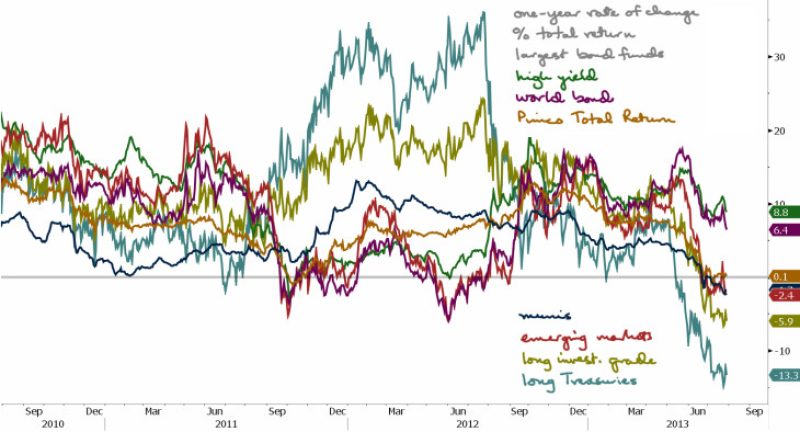
So that got me thinking. Here are the year-over-year changes in the largest funds in particular categories of the fixed income markets for the last three years.
While the chart is a bit more chaotic that I normally post, it tells a series of interesting stories.
You can see all of the lines heading down of late, as interest rates have jumped. You can also see how infrequently any of these funds have been down on an annual basis during this time, other than high yield and emerging market in the middle of the chart.
Look at long investment grade corporates and governments, the two lowest ones at the end of the chart. They haven’t seen anything like this. How will the holders react? The same goes for municipals, which has gone negative for the first time.
High yield and world bond are the exceptions, with attractive one-year returns, but they have headed down sharply since May.
Sitting on the zero line right now is the biggest fund of all, Pimco Total Return. It was here once before; can it bounce this time?
That will, of course, depend on economic and world events. But it also depends on the legions of conservative investors who open their statements and find that the funds that they have held dear have turned against them. (Chart: Bloomberg terminal.)


