Gold Market Radar (July 1, 2013)
For the week, spot gold closed at $1,223.96, down $72.60 per ounce, or 5.6 percent. Gold stocks, as measured by the NYSE Arca Gold Miners Index, lost 1.39 percent. The U.S. Trade-Weighted Dollar Index gained 0.99 percent for the week.
Strengths
- The last two trading days of the quarter saw gold stocks rebounding as well as some short covering. The bounce-back was not enough to reverse the early week losses where buyers stepped aside ahead of quarter-end producer gold liquidation. It is likely that the gold price pullback was a consequence of producers lining up to make gold sales, after likely having held off selling production over the course of the quarter due to the dramatic decline in the gold price. Having seen the price action this week, we feel more confident in our opinion that gold continues to be oversold and we believe investors should take this opportunity to take on or increase long positions.
- Klondex Mines announced some outstanding high grade channel sampling results from its Fire Creek gold project in Nevada. The exploration returned results as high as 22,396 grams per tonne (g/t) of gold 74 feet north of the 5400 cross cut. It also returned 20,231 g/t gold 63 feet north of the 5400 cross cut, and 15,891 g/t gold 69 feet north. These grades will let the company minimize dilution while maximizing grade and allow it to be more selective in its mining process.
- Troy Resources, which operates mines in Brazil and Argentina, is setting an example by announcing its CEO Paul Benson will cut his AUD$540,000 base salary by one quarter; senior executive salaries and directors' fees will be reduced by 10 percent. In January 2013, Gran Colombia Resources’ management embarked on a comprehensive review of its operations which identified $12 million in annual cost savings, a significant part of which will come from cuts to its senior executive salaries. We endorse and commend the example these two companies are setting in aligning their objectives with those of shareholders.
Weaknesses
- Citibank published a gold equity commentary this week in which it applied its proprietary global gold cost curve model to determine which companies have out-/under-performed peers on the global cost curve. A global gold unit cost increase of 15 percent year-over-year, and all-in costs increase of 1.3 percent suggests that companies are trying to adjust to the lower gold price environment by cutting capital expenditures, exploration and corporate costs. However, these cuts are insufficient given the expected fall in revenues and Citi estimates that most of the global gold producers are burning cash at spot levels.
- In a recent study, Fitch noted a potential dip below $1,000 per ounce in the gold price could result in dividend cuts by gold producers, as cuts to capital expenditures already have been implemented across much of the sector. Fitch added that, while companies may look to shed assets, capital raising continues to be difficult for small-to-midsized companies, advising that increased royalty and streaming transactions, as well as gold price hedging may occur.
- A survey by the Ontario Securities Commission (OSC) has found only 20 percent of National Instrument 43-101 reports filed by mining and exploration companies with the OSC are actually in compliance, while 40 percent are unacceptable. This is despite the strenuous requirements to qualify as an Independent Person under NI 43-101. The move increases the regulatory threat faced by junior developers and explorers, and is likely to slow down the mine development stage, while adding pressure to the already strained capital formation process.
Opportunities
- On its Gold Sector Note this week, Paradigm comments that despite the meltdown in the gold price on June 20 and June 26, and the subsequent sell-off in the gold equities, there are healthy signs for the sector. The current downturn, which started in September 2011, is pushing 1.8 years. Since 1976, there have been four major cycles in the gold sector. The average duration of the four previous downturns has been 3.6 years. However, noting that the two previous downturns were just two years apiece, and given the fundamental conditions observed, Paradigm believes this is likely to turn into a short downturn, in which the gold price will be bottoming out this summer.
- Mebane Faber, author and portfolio manager at Cambria Investment Management, wrote an article this week on what happened if and when you bought the U.S. equity sectors back when they were “really hammered.” Average three-year nominal returns when buying a sector down since the 1920s are 172 percent when the sector is down 80 percent and as much as 240 percent when the sector is down 90 percent. He admits it’s hard to buy something down 80 percent, especially if you owned it when it was down 30, 50, and then 80 percent. However, this tends to be the best time to be wading in. He goes on to mention recent examples of assets that fit the criteria: tech in 2002, homebuilders in 2009, and junior gold miners now.
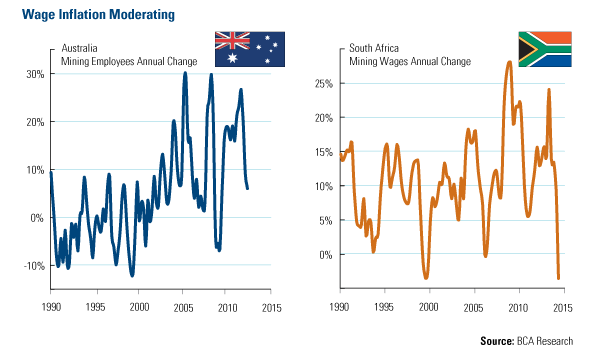
- BCA, in its Commodity Strategy note this week noted how in the 1990s miners retained operating margins above 15 percent and EBITDA margins above 30 percent despite chronically low metal prices. The tricks employed then to achieve profitability can also be use today. In addition to deferring capital expenditures, miners also enjoy natural savings from labor costs as activity is reduced. The chart above shows how the huge expansion in mining employment is topping out as layoffs in the Australian mining sector and deflation in South African wages hit the labor market.
Threats
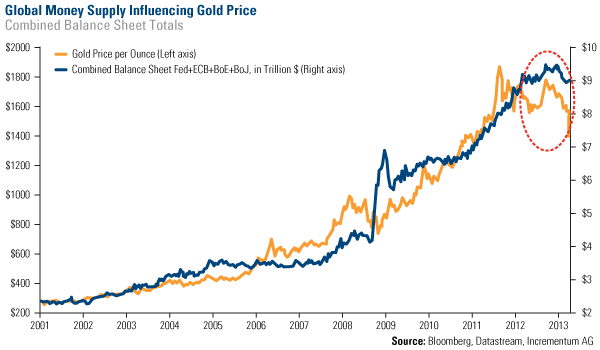
- The government announced on Wednesday gross domestic product expanded at an annual rate of 1.8 percent in the quarter, significantly below the previous report of the economy having grown at a pace of 2.4 percent. Both the federal government and independent economists cautioned that growth may weaken as the Fed ponders curtailing its monetary stimulus. Similarly, ISI cautioned this week that the growth assumption of 3.3 percent of GDP the Fed has forecast would be the fastest in a decade. As such, it may well not be achieved and the roadmap would have to be altered. The likely outcome, as Marc Faber noted late last week, is that the Federal Reserve will have no other option but to continue expanding the monetary base, a move that has supported gold’s price increase for more than 40 years.
- BMO reported in its Bond Market Focus of this week that the reason for the money supply remaining muted despite the massive increase in the monetary base is the low velocity of money we are experiencing. Money velocity is currently at its lowest level of the past 50 years which is why inflation remains subdued. The most likely reason for velocity reaching such low levels is the fact that banks are using the funds injected by the Fed to increase monetary reserves, rather than increasing the credit creation process by repeated rounds of loans and deposits. An artificially subdued inflation may pose a threat to the economy, as even a small change in the multiplier effect (the bank’s propensity to lend) could cause an inflation outbreak given the Fed-fueled expansion of the monetary base.
- Gold Stock Analyst commented on a note this week on the difference between the Comex and the NYSE when it comes to shorting. On a stock exchange, like the NYSE, a broker has to borrow the shares in order for one to sell them short, in addition to depositing the required margin funds. If the buyer of your shorted shares demands delivery, they have to be sent or your broker buys you in and you risk a loss. But on the Comex, all a shorter needs is the margin money, with no requirement that the quantity of the commodity shorted be found and available for delivery. This is a naked short, and is an exploitable loophole for investors with enough financial strength to manipulate a market lower by relentless selling. This type of activity has been weighing on gold prices, despite the fact that in a stock exchange it could be considered market manipulation.


