March 19, 2013
by Liz Ann Sonders, Senior Vice President, Chief Investment Strategist, Charles Schwab & Co., Inc.
Key Points
- The Dow Jones Industrial Average surpassed its all-time high in a series of record-breaking closes.
- However, new highs bring new worries about whether the market's come too far, too fast.
- We believe there's enough support under the market and economy to keep us on the side of the bulls.
Since my last report, the Dow Jones Industrial Average has surpassed its prior all-time high. Actually, it has managed a feat of nine consecutive new all-time highs since its first crossing on March 5. The S&P 500 Index came close, but has been held back to a significant degree by weakness in Apple (AAPL), which is not a component of the Dow.
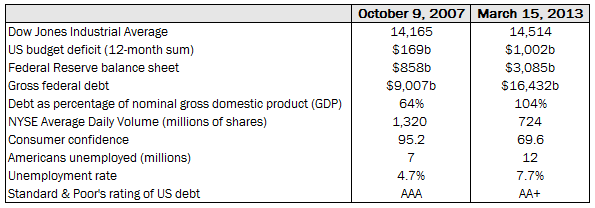
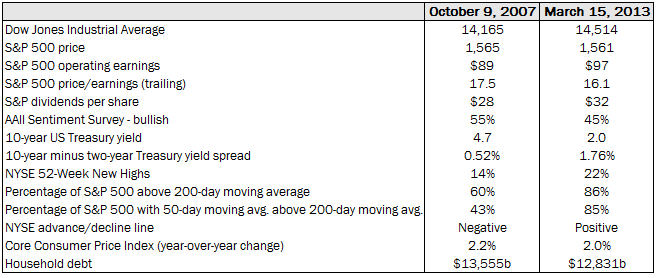
Let's start with a comparison of a variety of metrics (both market and economic) between today and the last time the Dow traded at these levels, in October 2007. I split the indicators into "good" and "bad" categories. We'll get the bad out of the way first:
Then and Now: The Bad
Source: Bloomberg, FactSet, Federal Reserve, Ned Davis Research (NDR), Inc. (Further distribution prohibited without prior permission. Copyright 2013 © Ned Davis Research, Inc. All rights reserved.), Standard & Poor's, as of March 15, 2013.
As you can see, it's the more macro/economic-oriented statistics that have worsened over the past 5½ years; notably the deficit and debt, as well as jobs and confidence. We've written extensively about the burden of debt and the deleveraging cycle that began in the private sector in 2008 but is only just now being addressed by the public sector.
But then there's the good news:
Then and Now: The Good
Source: Bloomberg, FactSet, Federal Reserve, NDR, Inc. (Further distribution prohibited without prior permission. Copyright 2013 © Ned Davis Research, Inc. All rights reserved.), Standard & Poor's, as of March 15, 2013. AAII=American Association of Individual Investors.
Notice that most of the better comparisons are many of the traditional stock market barometers, including earnings, valuation, technical conditions and inflation. Also better is the household sector's balance sheet, thanks to the aforementioned private-sector deleveraging that was forced upon it after the financial crisis erupted more than four years ago.
Benign pullbacks are more likely
But along with new highs have come concerns about whether the market's come too far too fast. We remain optimistic, but have consistently expressed the view that a pullback could occur at any time, especially in light of much higher levels of investor optimism, a contrarian indicator.
The news out of Cyprus was the trigger for the slight pullback the market's experiencing as I write this report. The story will have to play out, but we don't feel this represents the type of exogenous shock that could undermine the US stock market for any extended period of time.
US offsets
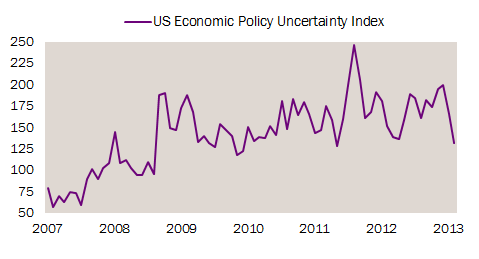
Although the eurozone crisis keeps policy uncertainty elevated, US policy uncertainty has been coming down sharply of late.
Less US Policy Uncertainty
Source: Scott Baker, Nicholas Bloom and Steven J. Davis at www.PolicyUncertainty.com, as of February 28, 2013. Index measures policy uncertainty and tests its relation with output, investment and employment.
New highs, new worries
In the meantime, I've been traveling all over the country and have been getting many questions about whether all-time highs are typically indicators of impending doom for the market. The answer, in short, is no.
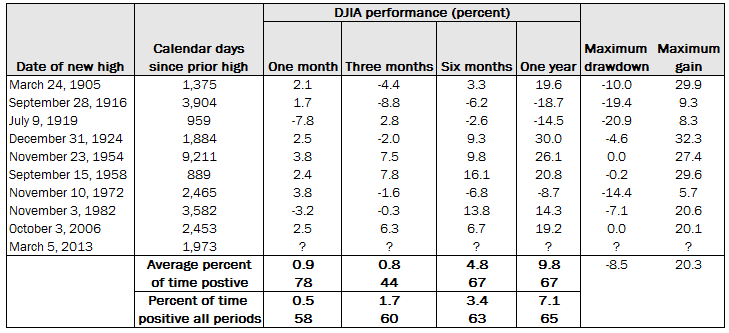
Until the Dow's record on March 5 this year, it had gone 1,973 days without hitting an all-time high. According to Bespoke Investment Group (BIG), that's the sixth-longest stretch the Dow has ever gone without closing at a new all-time high. It's also the second time in the past decade that the Dow has gone more than two years without closing at a new all-time high.
These periods of "drought" are very rare. As you can see in the table below, going back to 1900, there have only been 10 periods when the Dow went two or more years without closing at a new all-time high. For each period, also shown is how the index performed over the following one, three, six and 12 months.
New All-Time Highs in the Dow: 1900-2013
Source: Bespoke Investment Group, LLC (B.I.G.), as of March 15, 2013.
Looking at the average returns, there isn't much credence to the argument that you shouldn't be buying stocks when the Dow is trading at an all-time high. Over the following one, six and 12 months, the Dow saw better-than-average returns. Furthermore, while the average maximum drawdown (loss) was a decline of 8.5% over the following 12 months, the magnitude of the average maximum gain was more than twice that at over 20%.
Bullish case has plenty of supports
But history is never a perfect guide, and one can only rely on momentum so much. There have to be fundamental underpinnings to a market rally, so let's review the supports to the bullish case:
- Thanks to better economic readings lately, many economists are upping first-quarter real gross domestic product (GDP) estimates; some as high as 3%.
- "Don't fight the Fed" (or most other global central banks).
- Housing is firing on nearly all cylinders
- Unemployment claims (a fellow leading indicator with the stock market) are at a five-year low.
- Household net worth is on track to take out its prior all-time high this quarter.
- Industrial production and retail sales have been particularly strong (primary source of higher GDP forecasts for first quarter).
- Small business confidence is ticking up.
- Earnings revisions turning higher.
- Moderate, but persistent employment gains.
- Consumer financial obligations (mortgage/credit card payments, etc.) relative to disposable personal income are near record lows.
- The credit-card delinquency rate is at record low by wide margin.
- Highest year-to-date stock mutual fund inflows in seven years.
- About 90% of S&P 500 stocks are above their 200-day moving averages.
Demand versus supply
Let's dwell on the last bullet above for a moment. We're seeing an acceleration in demand for stocks, and it clearly relates to the market's momentum, but likely also fatigue by investors in cash investments earning nearly nothing. NDR has done extensive work on the relationship between supply of and demand for stocks as it relates to market tops and bottoms.
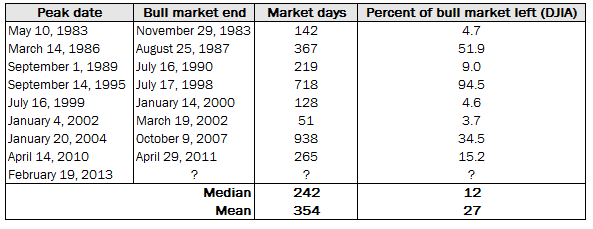
NDR's Demand Index crossed above its Supply Index last November and has continued to improve since that bullish sign. The lead times of a peak in demand to a peak in the stock market were quite variable going back to the early 1980s, but averaged 242 market days. This suggests a rather long period before we have to worry about a longer-term market peak. You can see the details below.
NDR Peak Demand Lead Times During NDR-Defined Bull Markets
Source: Ned Davis Research NDR, Inc. (Further distribution prohibited without prior permission. Copyright 2013 © Ned Davis Research, Inc. All rights reserved), as of March 11, 2013.
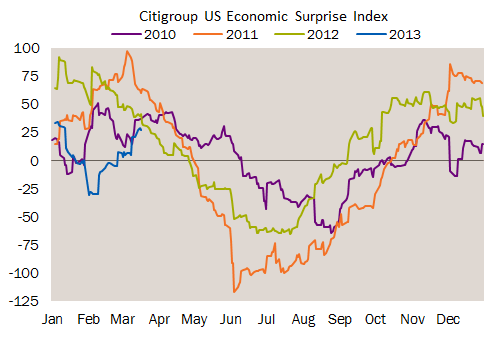
Shorter-term, the next worry for investors is whether we're going to see a fourth consecutive mid-year slowdown in the economy. As most investors probably recall, the US economy slowed meaningfully in 2010, 2011 and 2012, and as such, many are on high alert for yet another dip.
There are some reasons to hope for a break in that cycle given many of the factors noted in the bulleted list above. But meaningful weakness the past three years didn't rear itself until the April-May time frame (as you can see below via the Citi Economic Surprise Index comparisons), so we'll have to wait and see.
No Sign of Weakness Yet This Year
Source: FactSet, High Frequency Economics, as of March 15, 2013.
Not handing in the horns
In sum, the events in Cyprus put eurozone risks back in the spotlight and could lead to additional market volatility. But neither the stock nor credit markets have set off any longer-term alarm bells, and we think any near-term weakness is more likely than not a buying opportunity for stock investors.
Important Disclosures
The information provided here is for general informational purposes only and should not be considered an individualized recommendation or personalized investment advice. The investment strategies mentioned here may not be suitable for everyone. Each investor needs to review an investment strategy for his or her own particular situation before making any investment decision.All expressions of opinion are subject to change without notice in reaction to shifting market conditions. Data contained herein from third party providers is obtained from what are considered reliable sources. However, its accuracy, completeness or reliability cannot be guaranteed. Examples provided are for illustrative purposes only and not intended to be reflective of results you can expect to achieve.
Thumbs up / down votes are submitted voluntarily by readers and are not meant to suggest the future performance or suitability of any account type, product or service for any particular reader and may not be representative of the experience of other readers. When displayed, thumbs up / down vote counts represent whether people found the content helpful or not helpful and are not intended as a testimonial. Any written feedback or comments collected on this page will not be published. Charles Schwab & Co., Inc. may in its sole discretion re-set the vote count to zero, remove votes appearing to be generated by robots or scripts, or remove the modules used to collect feedback and votes.

