


by Charts, etc.
Could this finally be the start of a lasting run in gold equities? The GDX has been quietly rallying for the last six days:
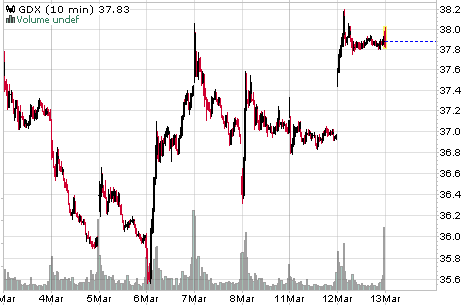
Source: Stockcharts.com
Note the much higher volume on advances with volume shrinking on declines = bullish action.
What’s even more encouraging is the relative performance of the GDXJ vs. GDX (see below), junior miners vs. majors. Ittends to show a similar relationship as the Russell 2000 Index vs. S&P 500 -- smaller-capsoutperforming larger-caps is generally bullish, indicating “risk-on” mode.

Source: Stockcharts.com
Granted a few days does not make a meaningful rally. But we know these stocks are beyond washed out so any kind of positive move isconstructive, indicating at least the chancea solid bottom has beenestablished and eveninvestor appetite is picking upfor these extremely-depressed stocks.
What does this mean for gold bullion? Typically when the junior miners outperform their senior brethren, it’s been decent as a timely indicator for gold. (Not much history given the inception date for the GDXJ is November 2009).
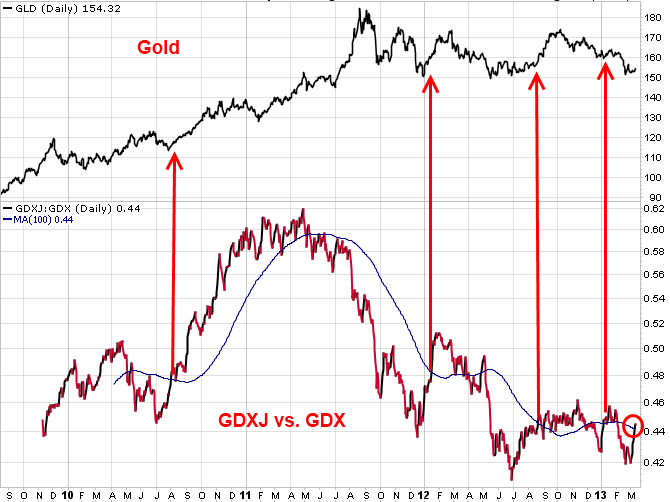
Source: Stockcharts.com
The chart above shows gold in the upper inset and GDXJ vs. GDX with its 100-day MA in the lower inset. When the GDXJ:GDX line has crossed up through its 100-day MA, it has tended to be a fairly good buy signal for gold.
In addition, looking at the weekly chart of GDXJ:GDX, there are more than a few bullish items evident.
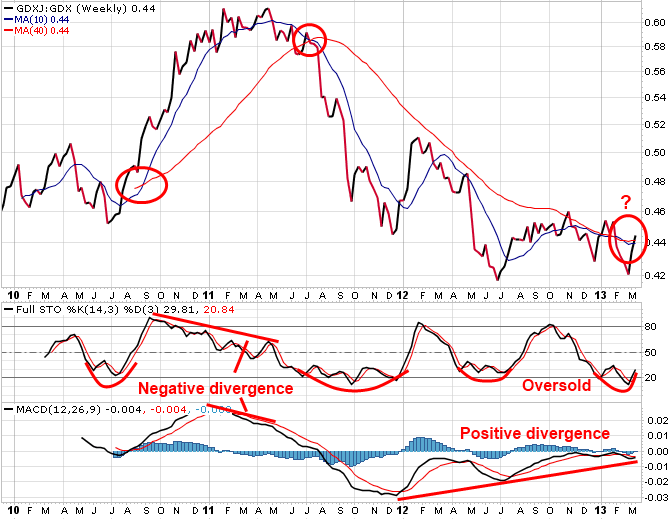
Source: Stockcharts.com
Note a bullish Golden Cross (50-dma moving up through the 200-dma) is very close to occurring. Also, you can see the GDXJ:GDX is oversold. Referring to the MACD, it has spent over a year trending up, creating a bullish divergence.
Finally, the GDXJ vs. GDX has registered not one but two weekly Tom DeMark Combo 13 signals, typically indicating bottoms.
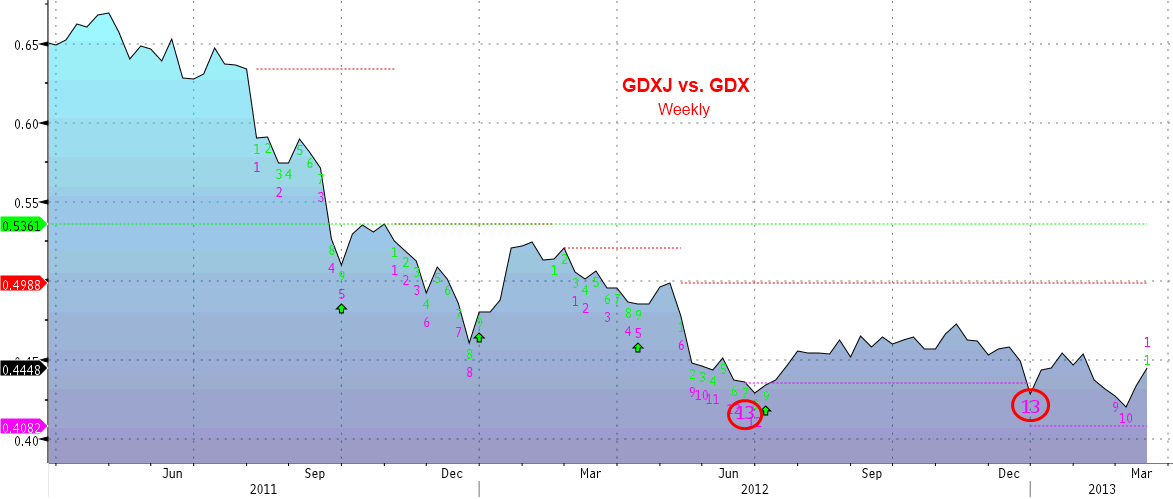
Source: Bloomberg
All in all, I remain bullish on gold bullion, and I'm getting increasingly less negative on gold equities. Stay tuned.
Copyright © Charts, etc.