by Don Vialoux, Tech Talk
Economic News This Week
February Retail Sales to be released at 8:30 AM EDT on Wednesday March 13th are expected to increase 0.5% versus a gain of 0.1% in January. Excluding auto sales, Retail Sales are expected to increase 0.5% versus a gain of 0.2% in January.
January Business Inventories to be released at 10:00 AM EDT on Wednesday March 13th are expected to increase 0.4% versus a 0.1% increase in December.
Weekly Initial Jobless Claims to be released at 8:30 AM EDT on Thursday are expected to increase to 350,000 from 340,000 last week.
February Producer Prices to be released at 8:30 AM EDT on Thursday are expected to increase 0.7% versus a gain of 0.2% in January. Excluding food and energy, PPI is expected to increase 0.2% versus a gain of 0.2% in January.
February Consumer Prices to be released at 8:30 AM EDT on Friday are expected to increase 0.5% versus no change in January. Excluding food and energy, CPI is expected to increase 0.2% versus a gain of 0.2% in January.
February Industrial Production to be released at 9:15 AM EDT on Friday is expected to increase 0.4% versus a decline of 0.1% in January. February Capacity Utilization is expected to increase to 79.4% from 79.1% in January.
March Michigan Sentiment Index to be released at 9:55 AM EDT on Friday is expected to increase to 77.8 from 77.6 in February.
Earnings News This Week
Equity Trends
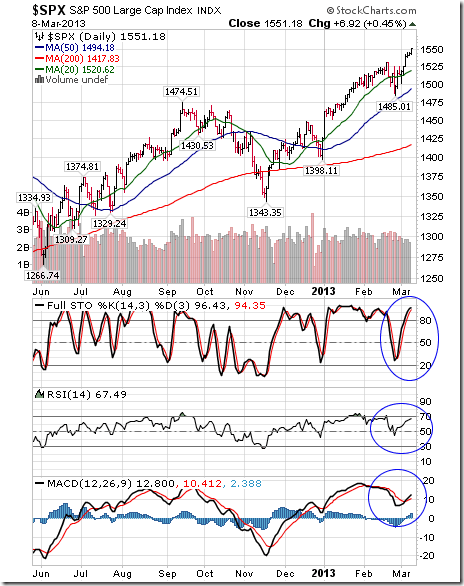
The S&P 500 Index gained 32.98 points (2.17%) last week. Intermediate uptrend was confirmed on a move above 1,530.94. The Index remains above its 20, 50 and 200 day moving averages. Short term momentum indicators are overbought, but have yet to show signs of peaking.
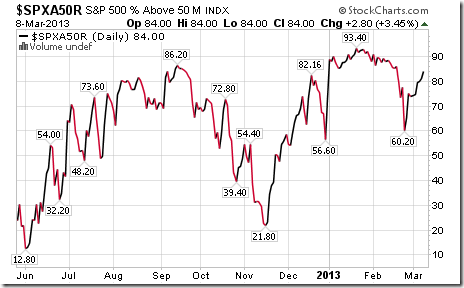
Percent of S&P 500 stocks trading above their 50 day moving average increased last week to 84.00% from 74.20%. Percent remains intermediate overbought.
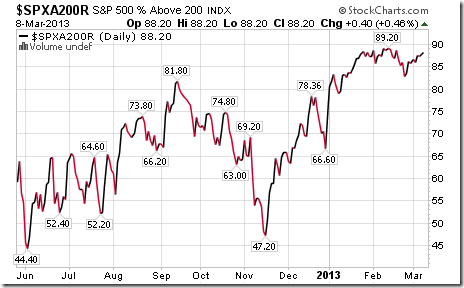
Percent of S&P 500 stocks trading above their 200 day moving average increased last week to 88.20% from 86.60%. Percent remains intermediate overbought.
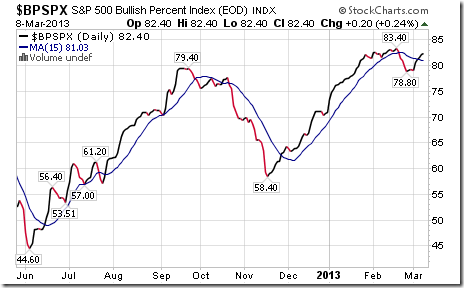
Bullish Percent Index for S&P 500 stocks increased last week to 82.40% from 79.00% and moved back above its 15 day moving average. Percent remains intermediate overbought.
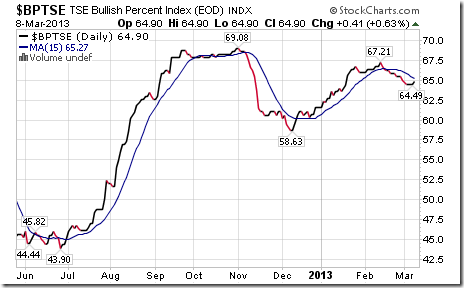
Bullish Percent Index for TSX Composite stocks increased last week to 64.90% from 64.75%, but remained below its 15 day moving average. The Index remains intermediate overbought.
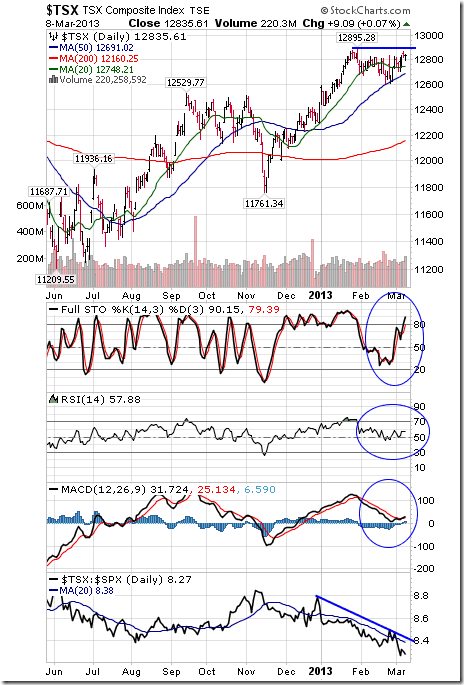
The TSX Composite Index added 62.49 points (0.49%) last week. Intermediate trend changed from down to neutral on a move above 12,823.50. Resistance is at 12,895.28.The Index remains above its 20, 50 and 200 day moving averages. Strength relative to the S&P 500 Index changed from neutral to negative. Short term momentum indicators are trending up.
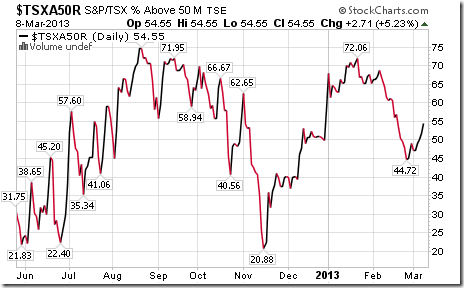
Percent of TSX stocks trading above their 50 day moving average increased last week to 54.55% from 47.13%. Percent has returned to an intermediate overbought level.
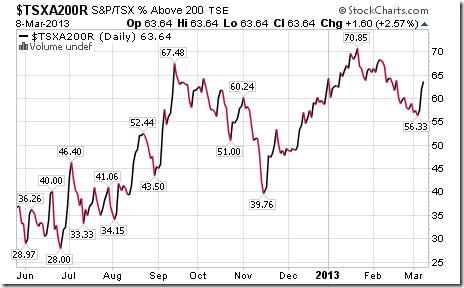
Percent of TSX stocks trading above their 200 day moving average increased last week to 63.64% from 56.97%. Percent has returned to an intermediate overbought level.
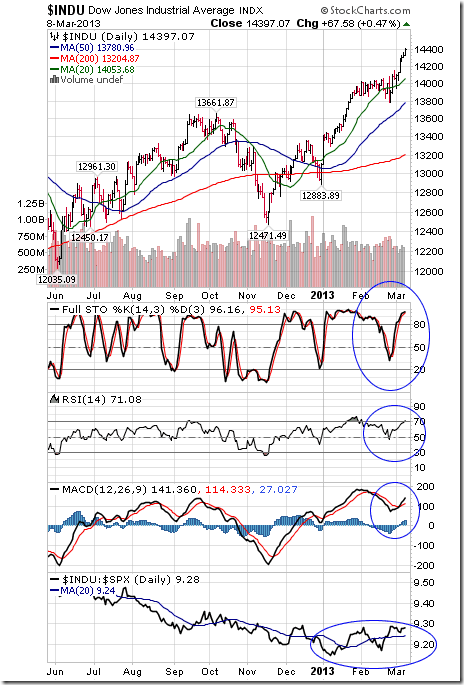
The Dow Jones Industrial Average gained 307.41 points (2.18%) to an all-time high last week. Intermediate trend is up. The Average remains above its 20, 50 and 200 day moving averages. Strength relative to the S&P 500 Index remains positive. Short term momentum indicators are overbought.
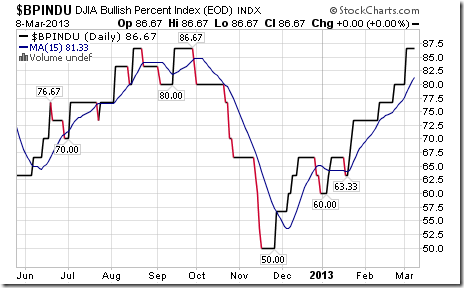
Bullish Percent Index for Dow Jones Industrial Average stocks increased last week to 86.67% from 80.00% and remained above its 15 day moving average. The Index remains intermediate overbought.
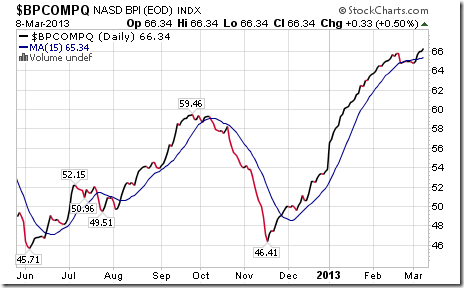
Bullish Percent Index for NASDAQ Composite stocks increased last week to 66.34% from 64.72% and moved back above its 15 day moving average. Percent remains intermediate overbought.
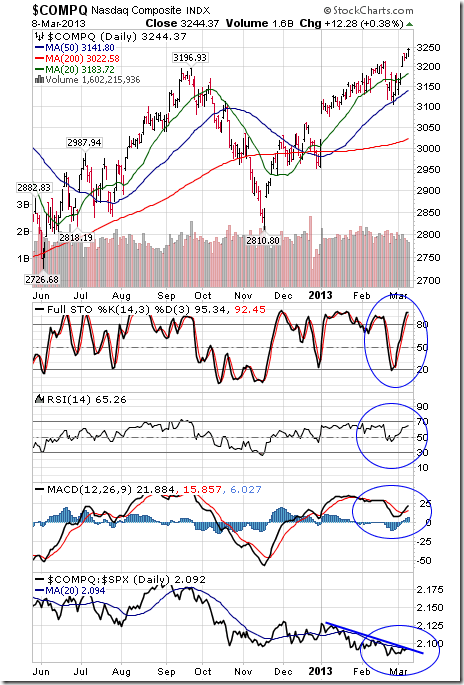
The NASDAQ Composite Index gained 74.63 points (2.35%) last week. Intermediate uptrend was confirmed on a move above 3,213.60. The Index remains above their 20, 50 and 200 day moving averages. Strength relative to the S&P 500 Index is negative, but showing early signs of change. Short term momentum indicators are overbought.
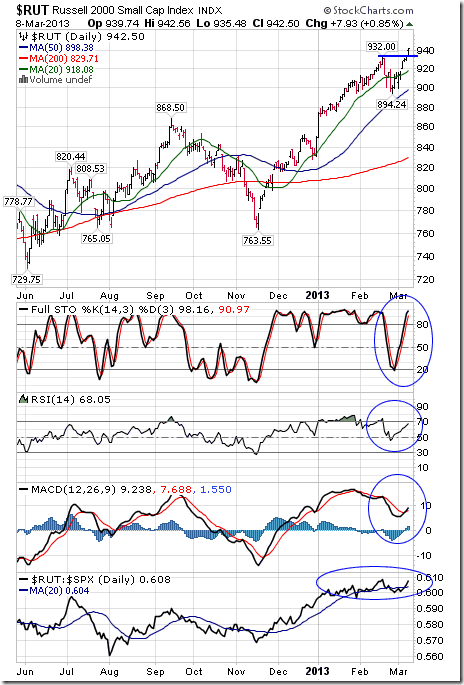
The Russell 2000 Index gained 27.77 points (3.04%) last week. Intermediate uptrend was confirmed on a break above 932.00 to an all-time high. The Index remains above its 20, 50 and 200 day moving averages. Strength relative to the S&P 500 Index changed from negative to neutral. Short term momentum indicators are overbought.
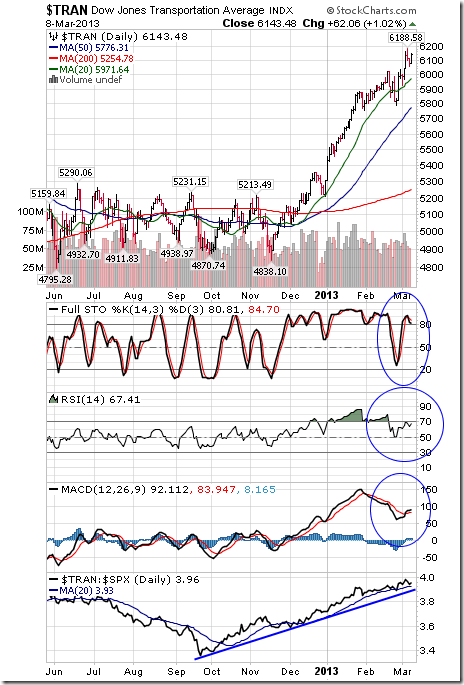
The Dow Jones Transportation Average added another 158.58 points (2.65%) last week. Intermediate trend is up. The Average remains above its 20, 50 and 200 day moving averages. Strength relative to the S&P 500 Index remains positive. Short term momentum indicators are overbought.
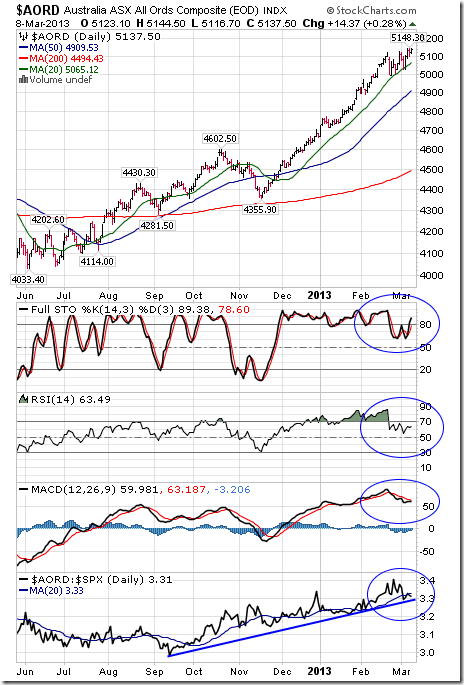
The Australia All Ordinaries Composite Index gained another 36.62 points (0.72%) last week. Intermediate trend is up. The Index remains above its 20, 50 and 200 day moving averages. Strength relative to the S&P 500 Index remains positive, but is showing early signs of change. Short term momentum indicators are overbought.
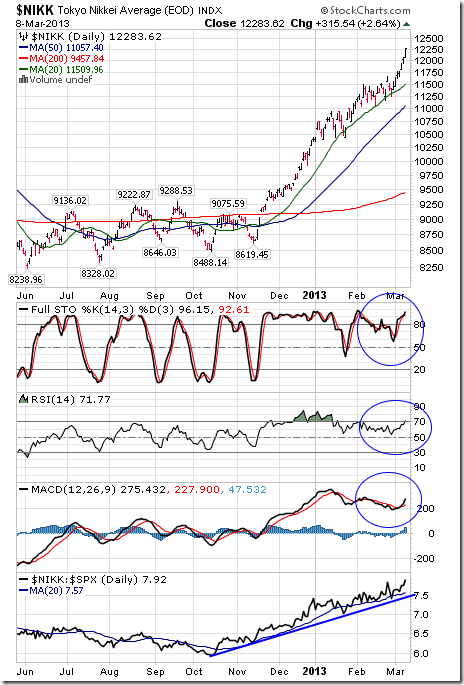
The Nikkei Average added another 677.24 points (5.84%) last week. Intermediate trend is up. The Average remains above its 20, 50 and 200 day moving averages. Strength relative to the S&P 500 Index remains positive. Short term momentum indicators are overbought.
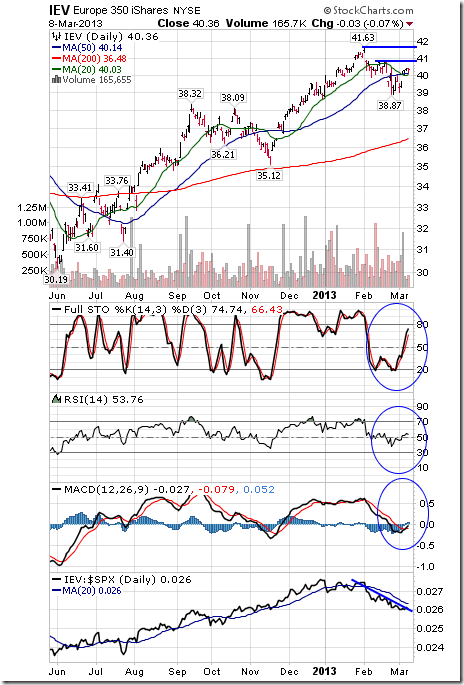
iShares on the Europe 350 Index added $0.86 (2.18%) last week. Intermediate trend remains down. Support is forming at $38.87. Units recovered above their 20 and 50 day moving averages last week. Strength relative to the S&P 500 Index remains negative. Short term momentum indicators are trending up.
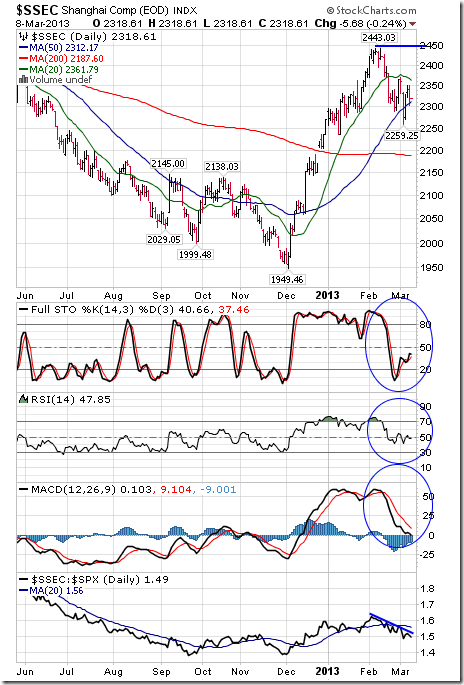
The Shanghai Composite Index fell 40.90 points (3.84%) last week. Intermediate trend is up. Resistance is at 2,443.03. The Index remains below its 20 day moving average and above its 50 and 200 day moving averages. Strength relative to the S&P 500 Index changed from neutral to negative. Short term momentum indicators are neutral.
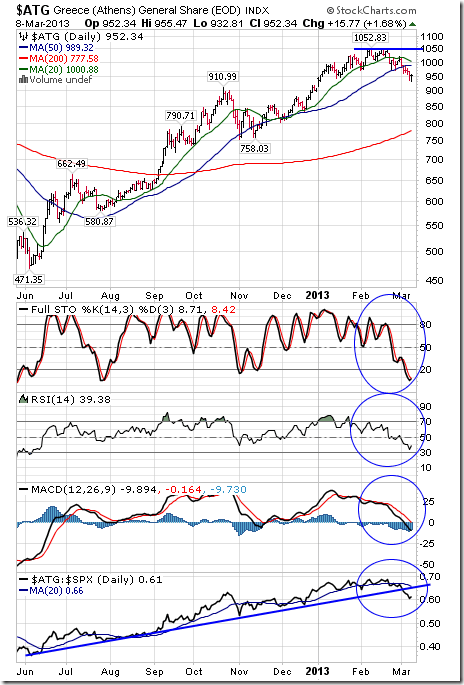
The Athens Index fell another 38.08 points (3.84%) last week. Intermediate trend is down. The Index remains below its 20 day moving average and fell below its 50 day moving average. Strength relative to the S&P 500 Index changed from neutral to negative. Short term momentum indicators are trending down.
Currencies
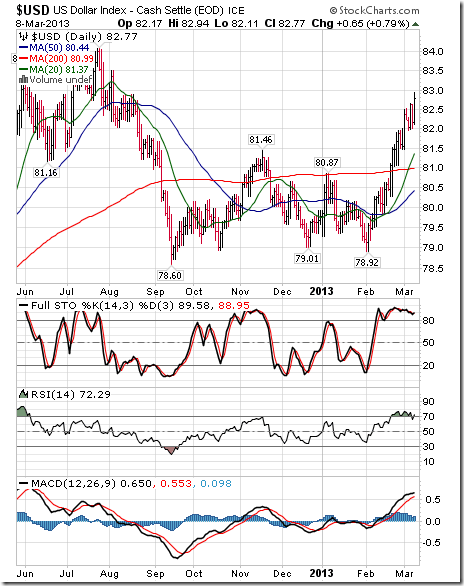
The U.S. Dollar Index gained another 0.82 (1.00%) last week. Intermediate trend remains up. The Index remains above its 20, 50 and 200 day moving averages. Short term momentum indicators are overbought, but have yet to show signs of peaking.
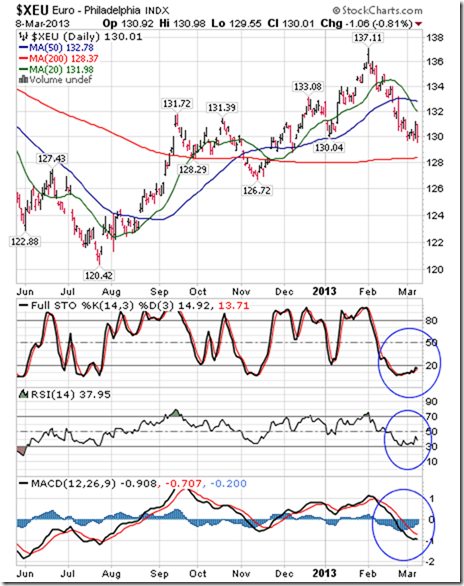
The Euro fell 0.18 (0.14%) last week. Intermediate trend is neutral. The Euro remains below its 20 and 50 day moving averages. Short term momentum indicators are oversold and showing early signs of bottoming.
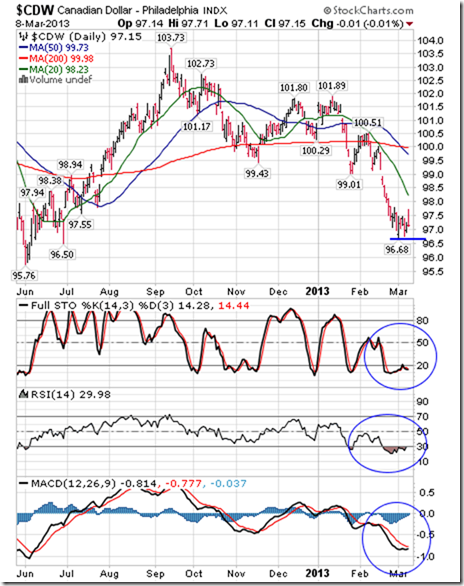
The Canadian Dollar dropped another 0.23 cents U.S. (0.24%) last week. Intermediate trend is down. Support is forming at 96.68 cents. The Canuck Buck remains below its 20, 50 and 200 day moving averages. Short term momentum indicators are oversold and showing early signs of bottoming.
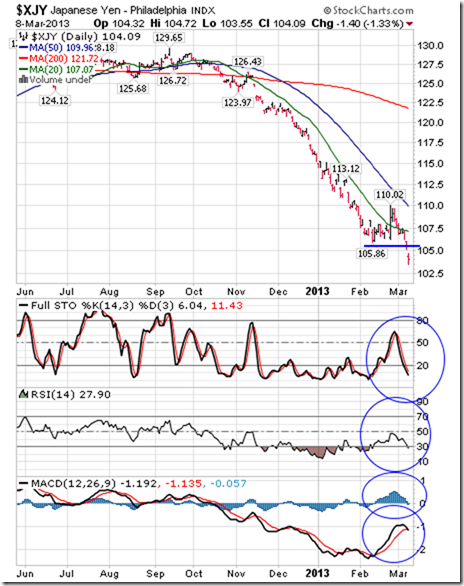
The Japanese Yen fell another 2.74 (2.56%) last week. Intermediate downtrend was confirmed on a break below support at 105.86. The Yen remains below its 20, 50 and 200 day moving averages. Short term momentum indicators are oversold.
Commodities
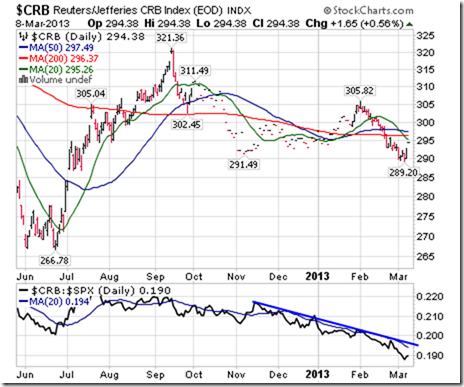
The CRB Index added 4.02 points (1.38%) last week. Intermediate trend remains down. The Index remains below its 20, 50 and 200 day moving averages. Short term momentum indicators are oversold and trying to bottom. Strength relative to the S&P 500 Index remains negative.
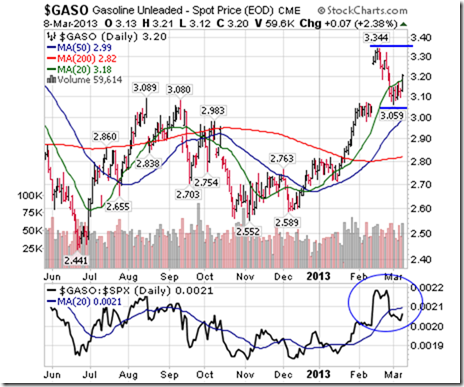
Gasoline gained $0.07 per gallon (2.24%) last week. Intermediate trend is up. Gas moved back above its 20 day moving average on Friday. Strength relative to the S&P 500 Index remains neutral.
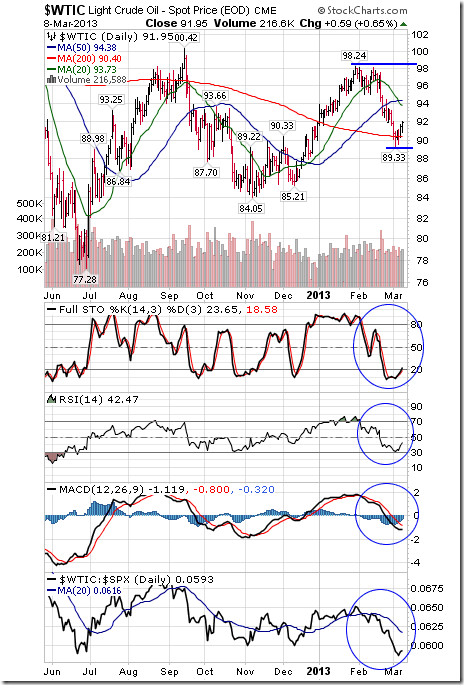
Crude Oil added $0.93 per barrel (1.02%) last week. Intermediate trend is down. Support is forming at $89.33. Strength relative to the S&P 500 Index remains negative. Short term momentum indicators are oversold and showing early signs of bottoming.
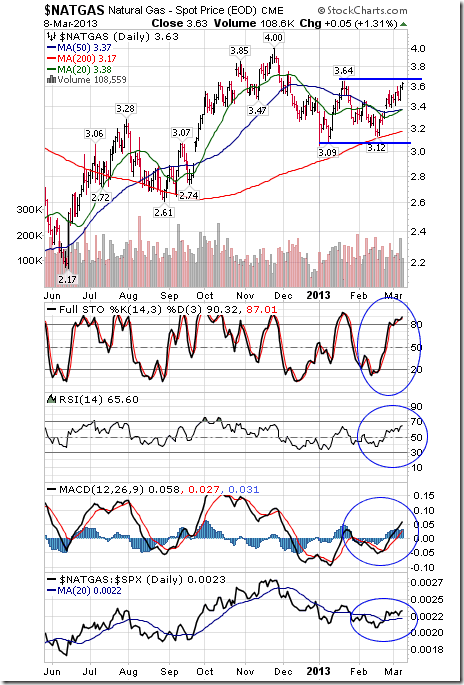
Natural Gas gained another $0.16 per MBtu (4.61%) last week. Intermediate trend is neutral. Gas remains above its 20, 50 and 200 day moving averages. Strength relative to the S&P 500 Index has changed from neutral to positive. Short term momentum indicators are trending up.
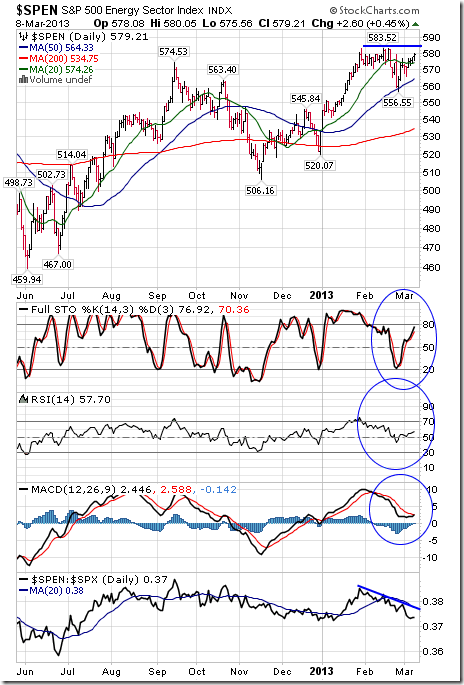
The S&P Energy Index added 7.08 points (1.24%) last week. Intermediate trend is neutral. Support is at 556.55 and resistance is at 583.52. The Index remains above its 50 and 200 day moving averages and moved back above its 20 day moving average. Strength relative to the S&P 500 Index remains negative. Short term momentum indicators are trending up.
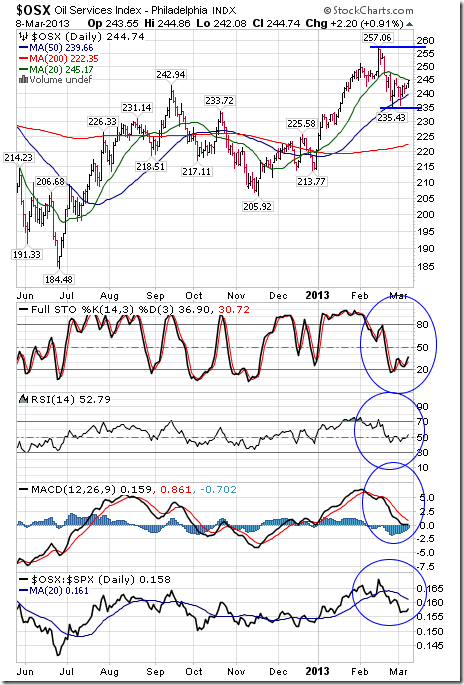
The Philadelphia Oil Services Index added 3.17 points (1.21%) last week. Intermediate trend remains neutral. Support is forming at 235.43. Resistance is at 257.06. Strength relative to the S&P 500 Index remains negative. Short term momentum indicators have declined to neutral levels.
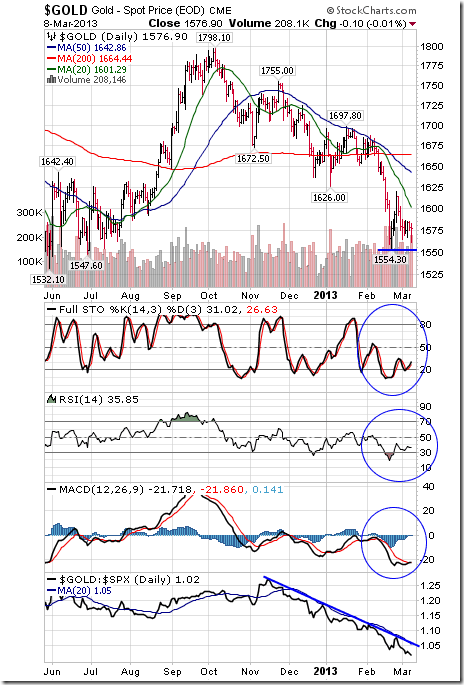
Gold was unchanged last week. Intermediate trend is down. Support is at $1,554.30 per ounce. Gold remains below its 20, 50 and 200 day moving averages. Strength relative to the S&P 500 Index remains negative. Short term momentum indicators are oversold and showing early signs of bottoming.
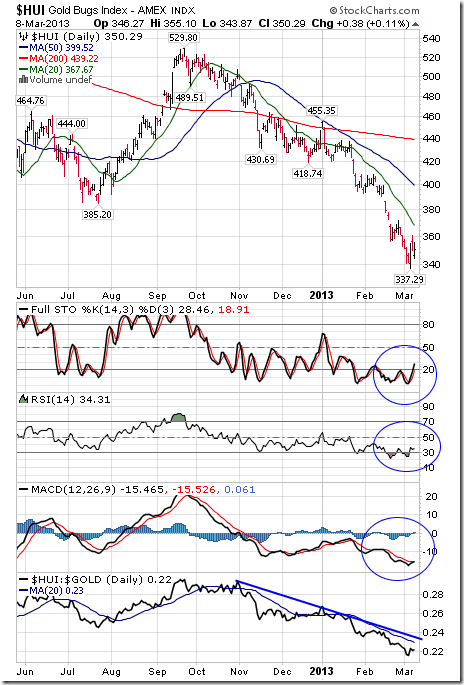
The AMEX Gold Bug Index slipped 1.49 points (0.42%) last week. Intermediate trend remains down. The Index remains below its 20, 50 and 200 day moving averages. Strength relative to the Gold remains negative. Short term momentum indicators are oversold and showing early signs of bottoming.
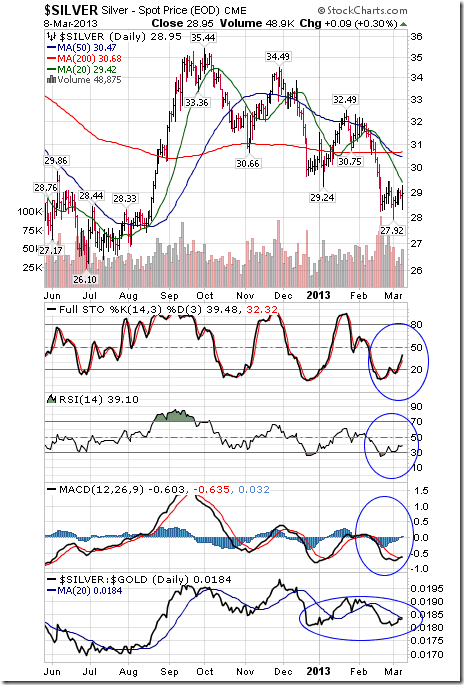
Silver added $0.40 per ounce (1.40%) last week. Intermediate trend is down. Silver remains below its 20, 50 and 200 day moving averages. Strength relative to Gold remains neutral. Short term momentum indicators are oversold and showing early signs of bottoming.
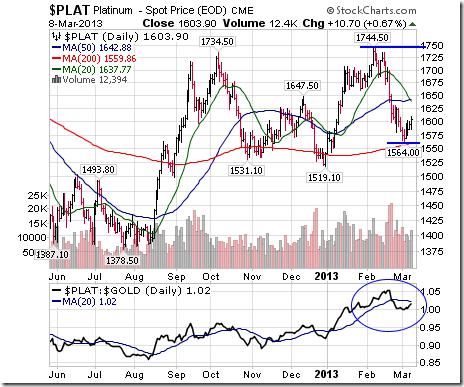
Platinum gained $28.90 per ounce (1.83%) last week. Intermediate trend is neutral. Platinum remains below its 20 and 50 day moving averages. Strength relative to Gold remains neutral.
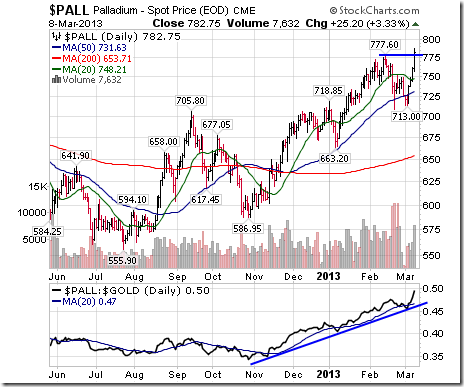
Palladium advanced $60.90 per ounce (8.44%) last week. Intermediate uptrend was confirmed on a break above $777.60 on Friday. Strength relative to the S&P 500 Index remains positive.
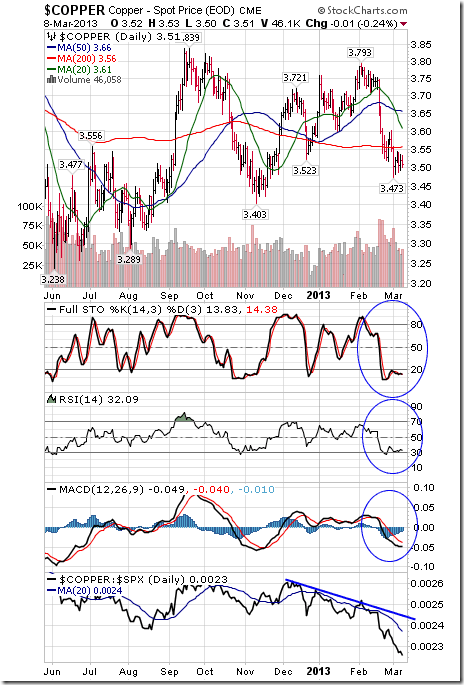
Copper slipped $0.01 (0.28%) last week. Intermediate trend is down. Copper remains below its 20, 50 and 200 day moving averages. Strength relative to the S&P 500 Index remains negative. Short term momentum indicators are oversold.
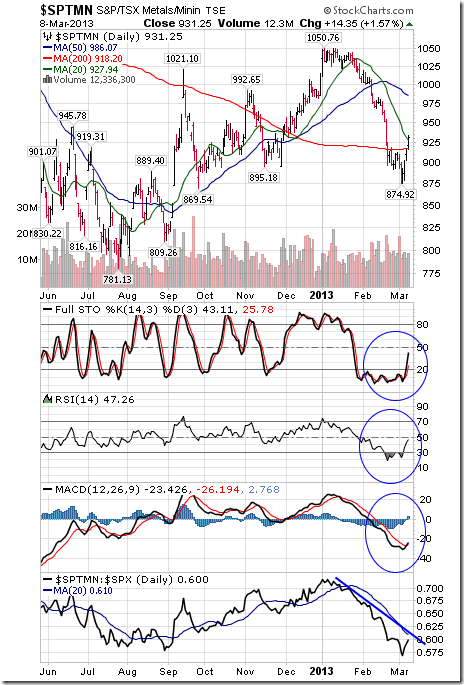
The TSX Metals and Mining Index added 31.14 points (3.46%) last week. Intermediate trend is down. The Index moved above its 20 and 200 day moving averages on Friday. Strength relative to the S&P 500 Index remains negative. Short term momentum indicators are oversold and showing signs of recovery.
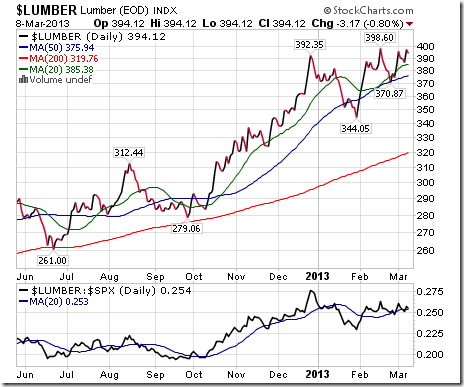
Lumber slipped $1.65 (0.42%) last week. Intermediate trend is up. Lumber remains above its 20, 50 and 200 day MAs. Strength relative to the S&P 500 Index remains slightly positive.
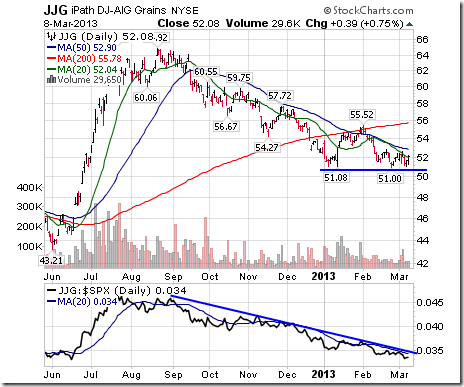
The Grain ETN slipped $0.28 (0.53%) last week. Intermediate trend is down. Units moved above its 20 day moving average on Friday. Strength relative to the S&P 500 Index remains negative.
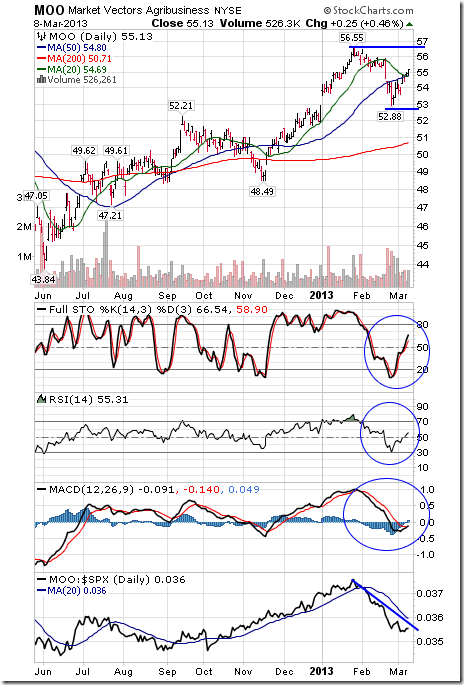
The Agriculture ETF added $1.00 (1.85%) last week. Intermediate trend is down. Units moved above their 20 and 50 day moving averages on Friday. Strength relative to the S&P 500 Index remains negative. Short term momentum indicators are recovering from oversold levels.
Interest Rates
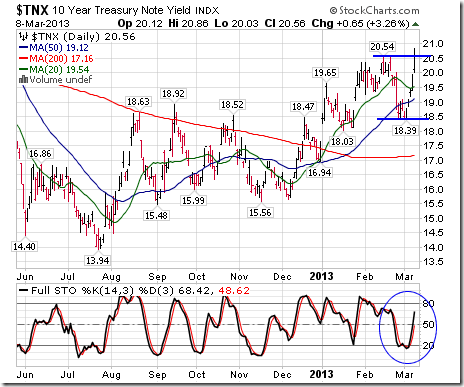
The yield on 10 year Treasuries gained 20.3 basis points (10.96%) last week. The largest gain occurred on Friday following release of the February employment report. Intermediate uptrend was confirmed on a break above 2.054% on Friday. Treasuries moved back above their 20 and 50 day moving averages. Short term momentum indicators are trending up.
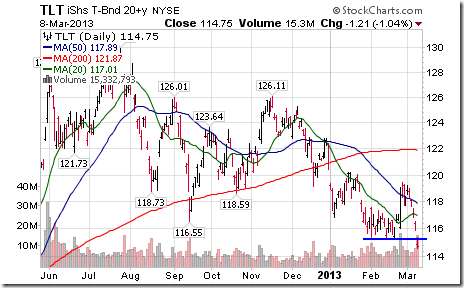
Conversely, price of the long term Treasury ETF fell $4.15 (3.49%) last week. Intermediate downtrend was confirmed on a break below support at $115.26.
Other Issues
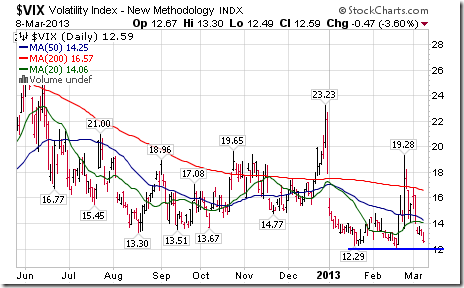
The VIX Index fell 2.79 (18.03%) last week. Support at 12.29% is being approached.
U.S. economic news last week unexpectedly was positive (ISM Services, ADP employment, weekly initial claims, non-farm payrolls and the unemployment rate). U.S. equity indices responded accordingly. Look for more positive economic news this week.
Earnings reports this week are not a significant influence on North American equity markets.
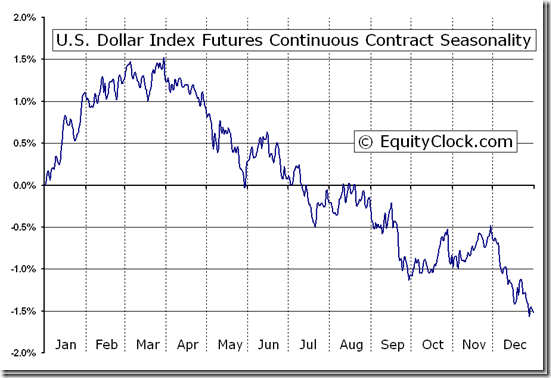
Currencies, particularly the U.S. Dollar, will continue to have an influence on equity and commodity prices. The U.S. Dollar is following its regular seasonal pattern (strong in January and February, peaking in March and declining thereafter). Watch for a peaking of the U.S. Dollar shortly followed by a recovery in commodity prices. Early technical signs in various currencies and commodities suggest that the rotation has started.
U.S. Dollar Index Futures (DX) Seasonal Chart
Political concerns related to a possible shut down of the U.S. government on March 27th appear have dissipated.
Short and intermediate technical indicators were surprisingly strong last week, but just returned to overbought levels.
Cash hoards remain high, but are declining as companies announce dividend increases and share buybacks.
The Bottom Line
Strength in U.S. equity markets last week triggered by surprising strength in economic indicators was unexpected. U.S. equity markets quickly regained short term momentum. Positive psychology related to the Dow Industrials reaching all-time highs also helped. This week, economic data is expected to be positive again and the S&P 500 Index (a more significant U.S. equity index) will have a chance of reaching its all-time high at 1,576.09. Meanwhile, short and intermediate technical indicators once again have returned to overbought levels.
Selected sectors with favourable seasonality at this time of year remain attractive purchases candidates on weakness. The trigger could be a rollover of the U.S. Dollar from a highly overbought level. If it happens, commodity stocks including metals & mining, energy, coal and steel stocks will come alive. All recorded exceptional gains on Thursday and Friday.
The latest weekly update on ETFs in Canada to March 1st is available at
Tom Rogers’ Weekly Elliott Wave Blog
Following is a link:
http://www.tomrogers.net/signpost.htm
Special Free Services available through www.equityclock.com
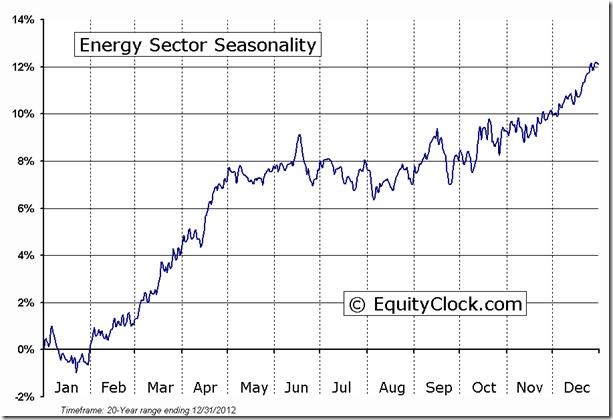
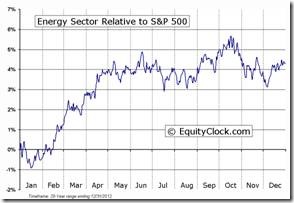
Equityclock.com is offering free access to a data base showing seasonal studies on individual stocks and sectors. The data base holds seasonality studies on over 1000 big and moderate cap securities and indices. Notice that most of the seasonality charts have been updated recently.
To login, simply go to http://www.equityclock.com/charts/
Following is an example:
Energy Sector Seasonal Chart
 |
Disclaimer: Comments and opinions offered in this report at www.timingthemarket.ca are for information only. They should not be considered as advice to purchase or to sell mentioned securities. Data offered in this report is believed to be accurate, but is not guaranteed.
Don and Jon Vialoux are research analysts for Horizons Investment Management Inc. All of the views expressed herein are the personal views of the authors and are not necessarily the views of Horizons Investment Management Inc., although any of the recommendations found herein may be reflected in positions or transactions in the various client portfolios managed by Horizons Investment Management Inc
Horizons Seasonal Rotation ETF HAC March 8th 2013
Copyright © Tech Talk


![clip_image002[5] clip_image002[5]](https://advisoranalyst.com/wp-content/uploads/HLIC/f322f588ed293a547d94515eca90a056.png)
