by Don Vialoux, TechTalk
Interesting Charts
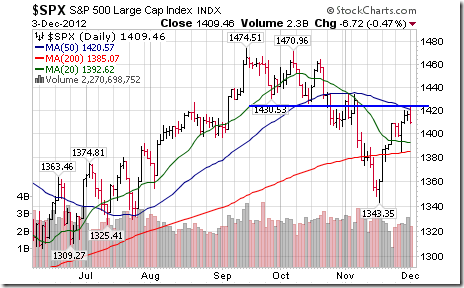
U.S. equity indices stalled as they approached the bottom of a previous trading range. Fiscal Cliff news and views continue to have an impact.
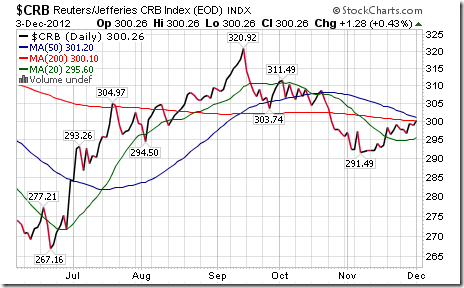
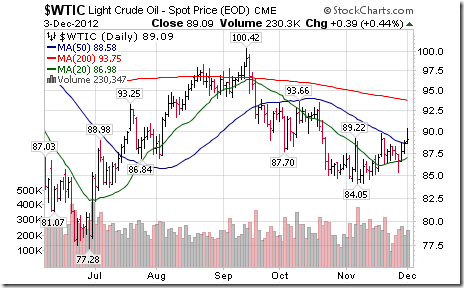
Commodity prices continue to creep higher. Weakness in the U.S. Dollar contributed.
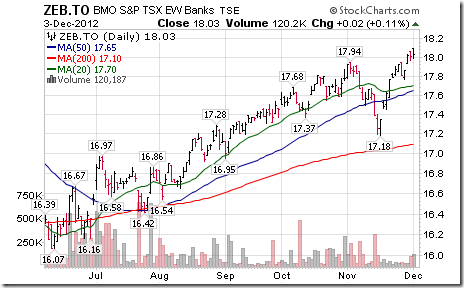
The TSX Financial Services Index and its related ETFs continue to strengthen in anticipation of fiscal fourth quarter results by Canada’s largest banks to be released this week.
Seasonality in the Month of December
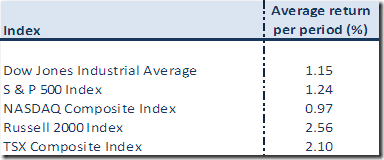
Thackray’s 2012 Investor’s guide notes that December is one of the best months of the year for equity markets. “Although the month tends to be positive, it’s the second half of the month that tends to produce the biggest returns. The best method of participating in the Christmas rally has been to enter the stock market on December 15th “.
Performance by broadly based North American equity indices during the past 10 Decembers is as follows:
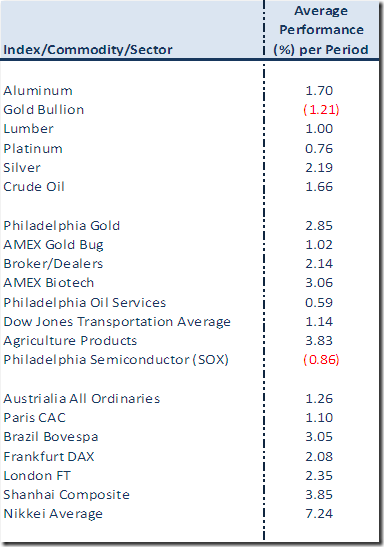
Best performing sectors during the past 20 Decembers were Industrials, Materials and Utilities. Best performing sub-sectors during the past 20 Decembers were Biotech, Metals & Mining, Gold equities and Agriculture Products. Worst performing sub-sectors was Airlines
Following is a summary of performance for other markets based on the past 10 Decembers
Prairie Crop Charts
Following is a link to Prairie Crop Charts with technical comments by Harold Davis:
http://www.prairiecropcharts.com/
INVESTMENT COMMENTARY
Tuesday, December 4, 2012
NEWSLETTER
Do you need to look at the big picture at times to figure out where you are at? Our latest issue of the CastleMoore Investment News is out. http://www.castlemoore.com/investorcentre/signup.php. Sign up and we’ll send it out, no obligations.
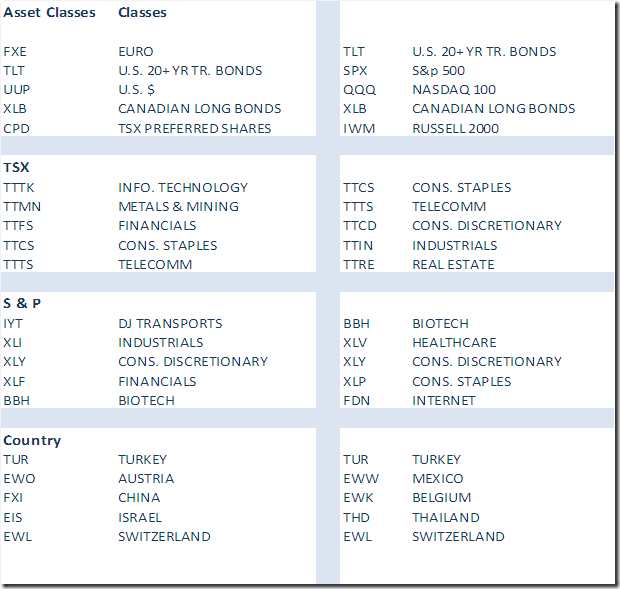
TOP ASSET CLASSES AND SECTORS: HEAT MAPPING
Comments:
With a new month started (really an old one ending) we see changes in the longer-term, the investible rankings of asset class, sector and countries. Across all three we see a clear shift towards a defensive theme including a big jump in the bonds, the US dollar (weekly) and preferred shares (weekly) with within the first grouping. Within CDN and US sectors the trend is fairly obvious with the only real stand-outs being info. tech and metals and mining. They buck the trend of a defensive shift as a result of exceptional individual stock movements in RIM and Inmet Mining with the sectors. While Turkey has been a stalwart for some time now, the move by Switzerland is in keeping with the theme of stability and safety.
CHARTS of the WEEK
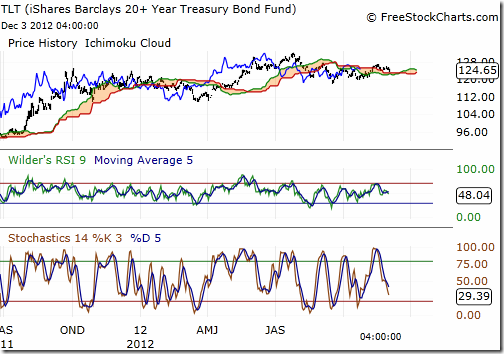
US Long Bonds
This daily look at US bonds (ETF TLT) shows a consolidation on the short term. A weekly close above $125 confirms an intermediate term re-acceleration.
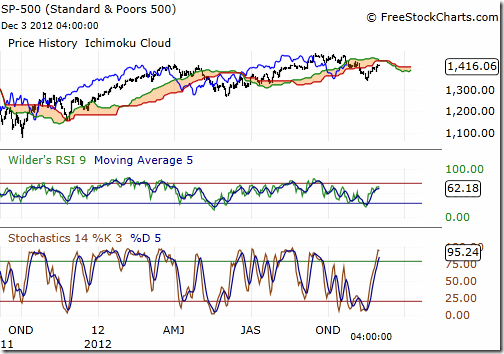
S&P 500
This daily S&P chart shows rising sentiment, though an upside is still in the cards to 1450. A longer term chart (not shown) reveals significant resistance overhead near 1545 that goes back to 2000 and 2007
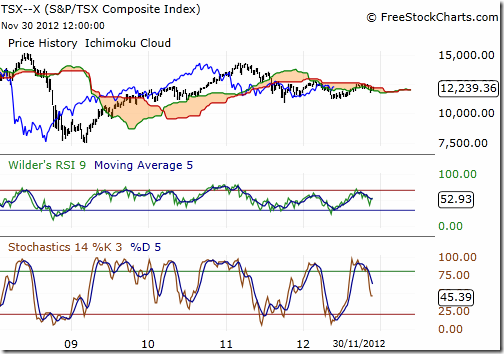
TSX Composite
This weekly look at the TSX shows investor indecision. Indicators are in the middle of their bands but rolling over. A day or two closes at these levels suggests that 12,100, then 11,800 will be tested. Corrective phases can begin with price action being flat.
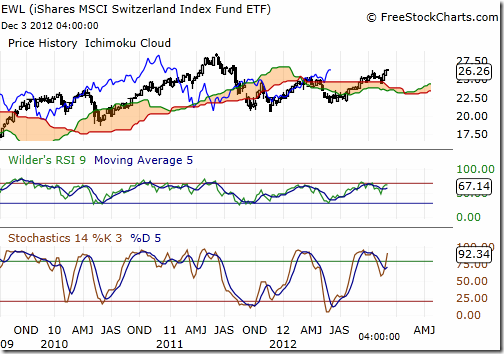
Switzerland
Switzerland is looks strong on the country rankings and maintains a buy signal (for disclosure CMI owns it in client portfolios) The ETF is dominated by Nestle, Novartis and Roche, companies in strong sectors discussed above.
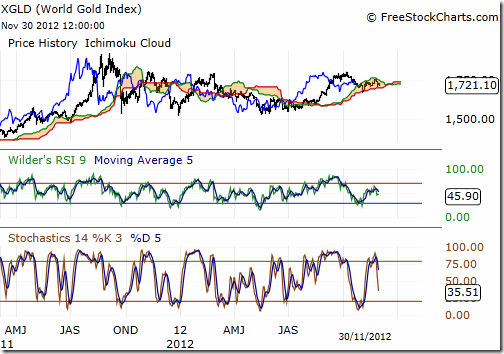
Gold Bullion
Gold bullion is in a 10 year bull market, and working off near term over-bought conditions. Rumour has it there was a big, individual (company or country) seller in the market in the last two weeks owing to some of the weakness. We currently own 10% of portfolios in gold, with one half in USD. We are awaiting pre-established conditions to add another 5% as part of our 15% original trade allocation.
If you like to receive bi-monthly newsletter, know more about our model portfolios or access an audio file of our investment philosophy, “Modern Financial Fiascos”, click on the link
http://www.castlemoore.com/investorcentre/signup.php.
CastleMoore Inc. uses a proprietary Risk/Reward Matrix that places clients with minimum portfolios of $500,000 within one of 12 discretionary portfolios based on risk tolerance, investment objectives, income, net worth and investing experience. For more information on our methodology please contact us.
CastleMoore Inc.
Buy, Hold…and Know When to Sell
This commentary is not to be considered as offering investment advice on any particular security or market. Please consult a professional or if you invest on your own do your homework and get a good plan, before risking any of your hard earned money. The information provided in CastleMoore Investment Commentary or News, a publication for clients and friends of CastleMoore Inc., is intended to provide a broad look at investing wisdom, and in particular, investment methodologies or techniques. We avoid recommending specific securities due to the inherent risk any one security poses to ones’ overall investment success. Our advice to our clients is based on their risk tolerance, investment objectives, previous market experience, net worth and current income. Please contact CastleMoore Inc. if you require further clarification on this disclaimer.
Special Free Services available through www.equityclock.com
Equityclock.com is offering free access to a data base showing seasonal studies on individual stocks and sectors. The data base holds seasonality studies on over 1000 big and moderate cap securities and indices.
To login, simply go to http://www.equityclock.com/charts/
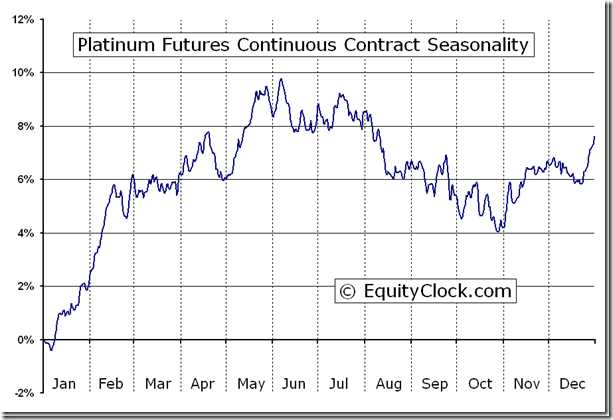
Following is an example:
Platinum Futures (PL) Seasonal Chart
Disclaimer: Comments and opinions offered in this report at www.timingthemarket.ca are for information only. They should not be considered as advice to purchase or to sell mentioned securities. Data offered in this report is believed to be accurate, but is not guaranteed.
Don and Jon Vialoux are research analysts for Horizons Investment Management Inc. All of the views expressed herein are the personal views of the authors and are not necessarily the views of Horizons Investment Management Inc., although any of the recommendations found herein may be reflected in positions or transactions in the various client portfolios managed by Horizons Investment Management Inc
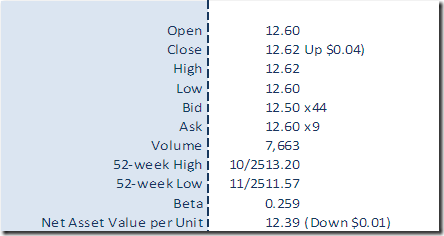
Horizons Seasonal Rotation ETF HAC December 3rd 2012


