Upcoming US Events for Today:
- Motor Vehicle Sales for November will be released throughout the day.
- PMI Manufacturing Index for November will be released at 8:58am. The market expects 52.1 versus 51.0 previous.
- ISM Manufacturing Index for November will be released at 10:00am. The market expects 51.7, consistent with the previous report.
- Construction Spending for October will be released at 10:00am. The market expects an increase of 0,4% versus an increase of 0.6% previous.
Upcoming International Events for Today:
- German PMI Manufacturing for November will be released at 4:00am EST. The market expects 46.8 versus 46.0 previous.
- Euro-Zone PMI Manufacturing for November will be released at 4:00am EST. The market expects 46.2 versus 45.4 previous.
- Great Britain PMI Manufacturing for November will be released at 4:30am EST. The market expects 48.0 versus 47.5 previous.
The Markets
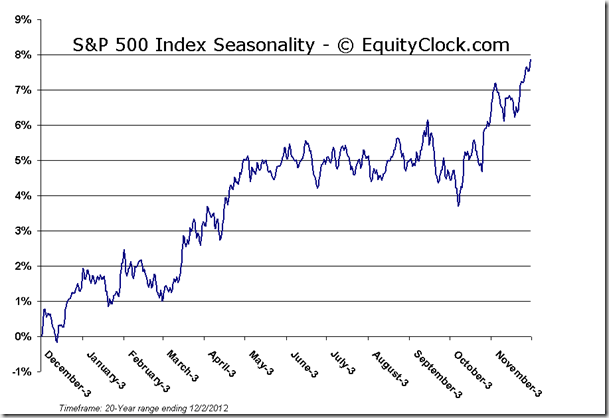
Markets ended close to the flatline on Friday capping off a week and month of gains. For the week, the S&P 500 ended higher by 0.50%, the Dow Jones Industrial Average close up by 0.12%, and the Nasdaq saw gains of 1.46%. And despite a volatile month as investors quickly digested the results of the presidential election and turned immediately to the fiscal cliff concerns, major equity benchmarks managed to finish in the green for November. The Nasdaq was higher by 1.11% last month, while the S&P 500 gained 0.28%. On a seasonal basis, December is expected to see the continuation of gains with the S&P 500 posting an average return of 1.55% over the month, while the Nasdaq returns an average of 2.21%, based on data from the past 20 years. Gains in the last half of the month, attributed to the Santa Claus Rally, primarily drive returns for the period. Market performance over this final month of the year will obviously remain dependent on fiscal cliff negotiations, which at the end of last week had shown some signs of stalling.
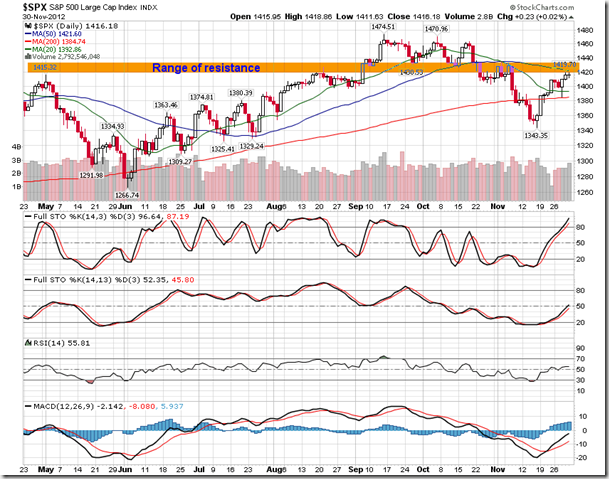
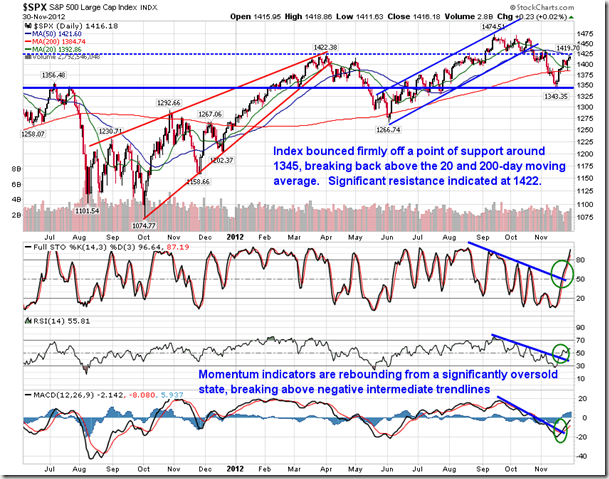
Looking at the daily chart of the S&P 500 index, momentum indicators continue to show signs of improvement, however, resistance at the 50-day moving average line is being suggested based on last week’s close. The large cap index is facing tremendous overhead resistance, bound by a range between the 50-day moving average and November’s highs, around 1435. Should this range of resistance be broken to the upside, a test of the year-to-date highs around 1475 is increasingly likely. Short-term momentum indicators, such as stochastics, are already indicating that equities are overbought following the rally that has been ongoing for the past two weeks. Strongly positive tendencies attributed to the Thanksgiving holiday and the November month-end conclude into the first few days of December, at which point tax-loss selling pressures typically take the market lower into mid-month. This short-term drift lower is followed by the classic holiday trade in the week before and after Christmas as Santa Claus delivers the gift of market gains. Given that many hedge funds have largely underperformed their benchmarks this year due to the extreme fundamental uncertainties, expect an attempt at a huge push higher for equitues into these remaining days of the year as funds attempt to meet or exceed targets.
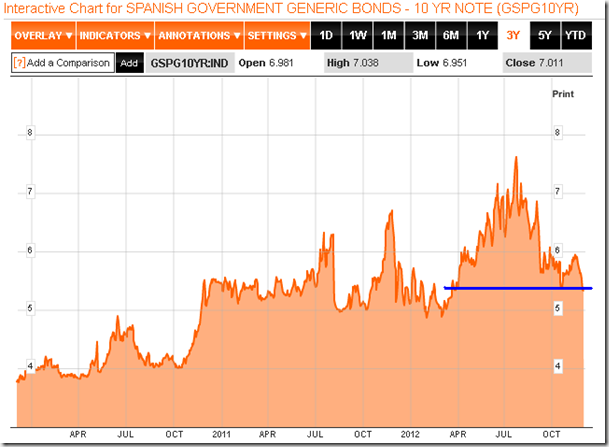
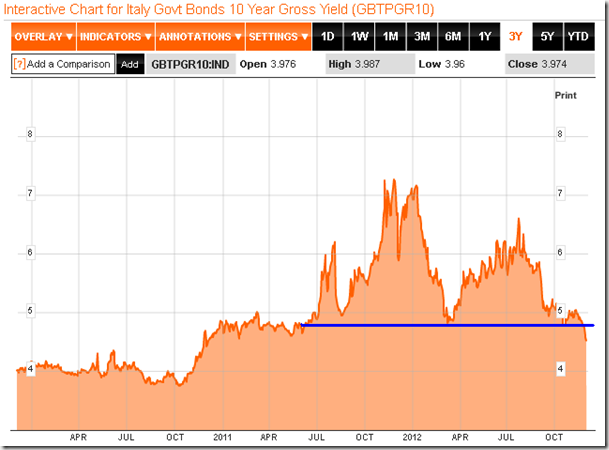
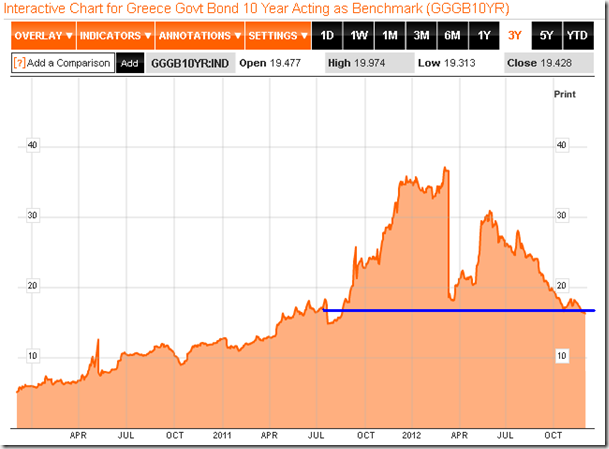
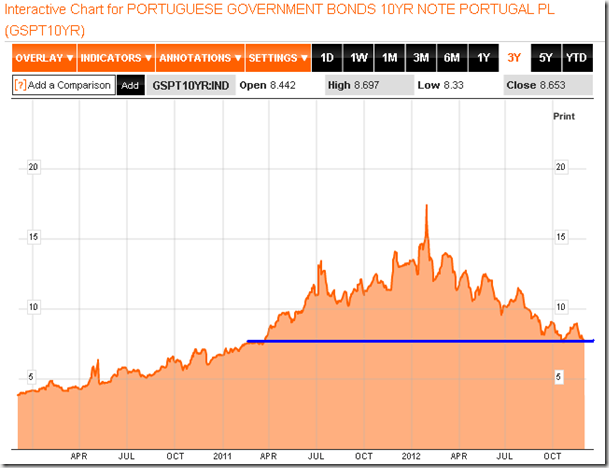
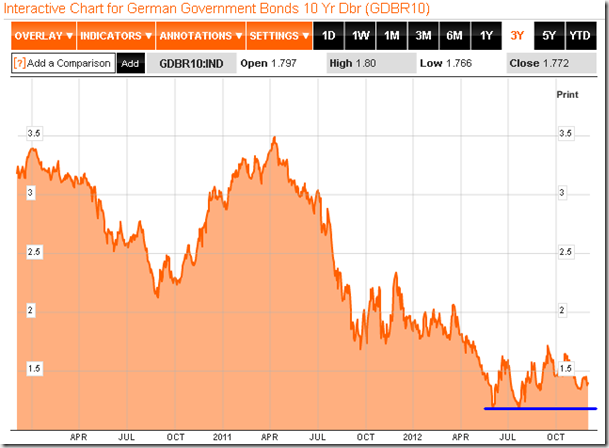
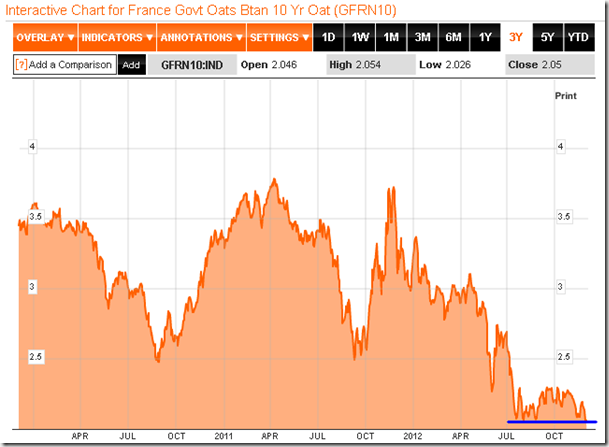
While fiscal cliff negotiations are ongoing, investors can begin to cross off one of the significant overhanging issues to the market over the past year. Yields on European debt are falling to the lowest levels in many months. Spanish Government 10-year bond yields have fallen to the lowest levels in eight months, while Greece, Portugal, and Italy have seen their yields fall to the lowest levels in well over a year. Concerns over the Euro-zone debt issues are alleviating as leaders within the area take steps to mitigate out of control borrowing costs. Meanwhile, the apparent safe-haven bonds within the EU have seemingly stabilized, defining levels of support as demand tails off. Yields in Germany and France are holding above the lows set in July when European debt concerns reached a peak. Continued improvement in bond yields in Greece, Italy, and Spain should further fuel the outperformance of European indices as benchmarks in the region attempt to play catchup to the strong performance recorded in the US over the past couple of years.
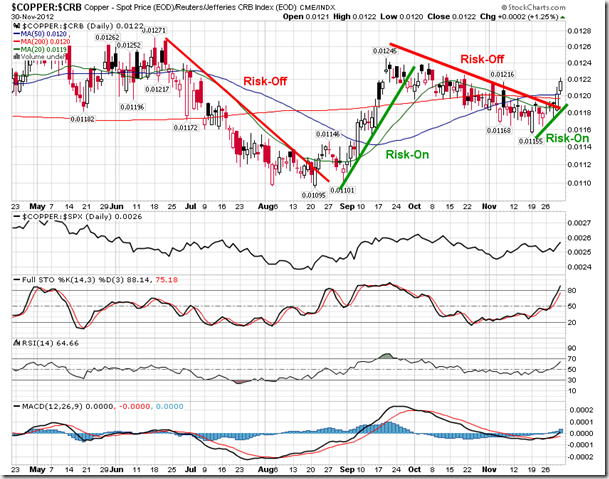
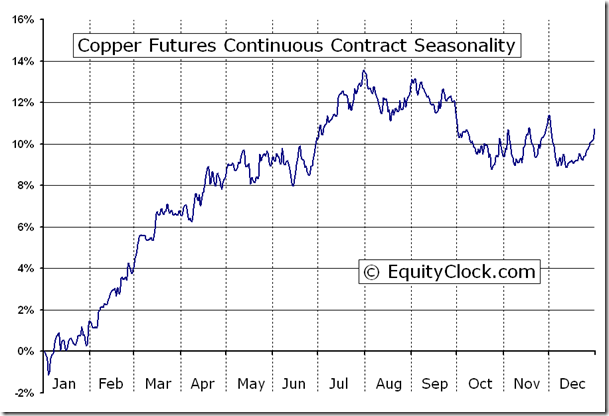
One of the things we look for to determine the strength of equity markets is the relative performance of risk assets. Copper has recently provided a risk-on signal by breaking out of a declining relative performance trend compared with the CRB Commodity index. The commodity is also showing positive relative performance compared to equity benchmarks, such as the S&P 500. The performance of copper is often considered to be a leading indicator to equity market performance due to the economic strength that an improvement in copper demand implies. Copper enters into a period of seasonal strength from mid-December through to May as a pickup in industrial production and manufacturing drive demand for the commodity.
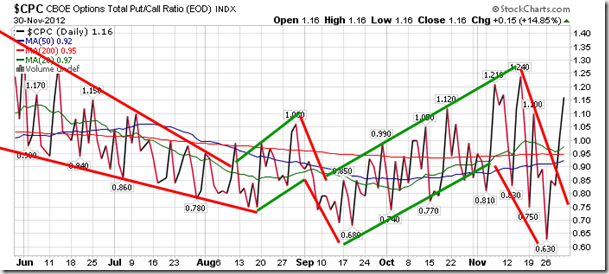
Sentiment on Friday, as gauged by the put-call ratio, ended bearish at 1.16, rebounding significantly off of the complacent levels recorded to start the week. Despite the rather flat equity returns on the session, skepticism over further market gains continues to dominate as investors hedge positions with put options. Increased put option activity can also indicate negative bets on the market, as opposed to hedging of positions, which can lead to investors having to place bullish bets in the sessions to follow if the negative scenario does not materialize. Covering of negative bets often adds a swift and powerful bid to the market, causing equity prices to jump as investors chase performance.
Chart Courtesy of StockCharts.com
Chart Courtesy of StockCharts.com
Horizons Seasonal Rotation ETF (TSX:HAC)
- Closing Market Value: $12.58 (down 0.08%)
- Closing NAV/Unit: $12.60 (down 0.07%)
Performance*
| 2012 Year-to-Date | Since Inception (Nov 19, 2009) | |
| HAC.TO | 3.45% | 26.0% |
* performance calculated on Closing NAV/Unit as provided by custodian
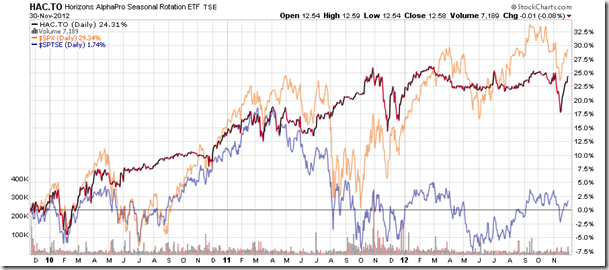
Click Here to learn more about the proprietary, seasonal rotation investment strategy developed by research analysts Don Vialoux, Brooke Thackray, and Jon Vialoux.


