Fixed income might have the word “fixed” in its name, but there is nothing truly “fixed” about it – it’s actually a very dynamic asset class that is constantly growing and evolving.
While it’s one thing to say that, it’s another to see it in action, and you can do that by looking at the Barclays US Aggregate index. The Aggregate is the most commonly used fixed income benchmark by US investors, according to Morningstar and BlackRock data as of July 31. It is also the stated benchmark for a range of mutual funds and ETFs — both index and active. Think of it as the bond market’s equivalent of the S&P 500 index. The same way you wouldn’t expect the S&P 500 index to hold the same companies it did when it was first published in 1957 (anyone remember Gimbel Brothers or Montgomery Ward?), you wouldn’t expect the Aggregate to look the same today as it did when it was launched.
If you were tracking the Aggregate since its inception, what would you have seen in the past 26 years? Let’s take a look back in time.
History of the Barclays US Aggregate Index
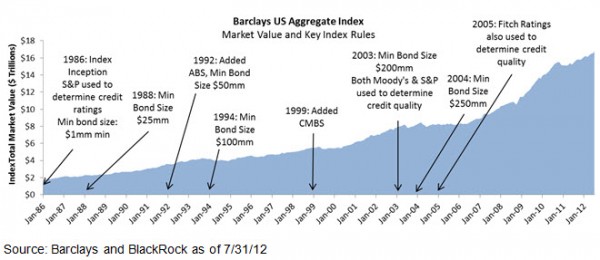
Bond market indices appeared on the scene in the 1970s. The first indices were comprised of government and corporate bonds, while sectors like mortgage and asset-backed securities were still in their infancy. The Government Credit index was the first flagship benchmark; it was designed for pension plans and other taxable investors to be a benchmark for their bond portfolios. In 1986 mortgage backed securities were added to the Government Credit index to create a new benchmark and the Aggregate was born. Over time, the index rules for the Aggregate have evolved to reflect changes in market composition, bond issuance sizes and the sectors deemed investible by investors.
 The Barclays US Aggregate Index is a market value weighted index, so as more bonds are issued in a sector or industry, the weight of that sector will increase in the index. In addition, as the price of a particular bond or sector changes, so too does its weight in the index. (Keep in mind that the Aggregate index only includes the taxable US bond market, meaning muni bonds are excluded.)
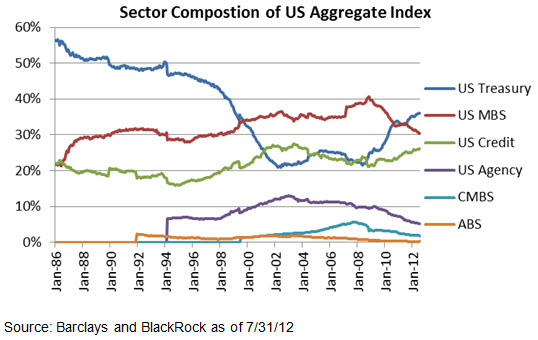
How do these rules play out in the real world? Well, let’s look at Treasuries. We are all very aware of the increase in government debt that we have seen in the past few years. This issuance has driven the Treasury component of the Aggregate up from 21% in 2002 to 36% today. But look at the chart below. Despite this recent surge, this weighting is still far below what we saw in the 1980s and 1990s, when Treasuries reached a peak of 56%. In the 1990s the Treasury began buying back their outstanding debt, while Corporate and MBS issuers continued to bring new bonds to the market. As a result, the weighting of Treasuries fell in the Aggregate, while we saw the weightings of Corporates and MBS rise.
 The chart shows other ways in which the history of the financial market in general and the bond market in particular are echoed in the Aggregate. We can see that securitized assets such as mortgage-backed securities (MBS) jumped in index weighting from 2006 until 2008, as more mortgage loans were originated to fuel the housing boom. But once the housing bubble burst, fewer mortgages were originated and the weight of MBS in the index dropped.
Let’s look at US Agency securities. These securities were originally included in the Government index until a stand-alone agency index was created in 1994. From there, we saw their issuance and index weight rise steadily in the Aggregate for the next decade. But that trend ended in 2009, when the two largest issuers in the index, Fannie Mae and Freddie Mac, entered government conservatorship and began to reduce the size of their balance sheets. With smaller balance sheets, their borrowing needs have declined and so too has the weighting of government agencies in the Aggregate index. Today, Agencies represent only 6.6% of the Aggregate.
As you can see, since 1986 the Aggregate index has remained anything but static. An investor holding an Aggregate-based fund will see that fund morph over time to reflect the economic realities of the day. Despite all of these changes, the Aggregate index has maintained a correlation with the S&P 500 index of 0.002 in the past 10 years, according to BlackRock and Bloomberg data as of July 31. That allows the index to provide diversification against riskier asset classes in a broad portfolio, and Aggregate-based funds can offer core bond market exposure. But just as the Aggregate has evolved, so too have bond funds. Investors looking for more customized exposure can mix and match segments of the Aggregate and combine them with other fixed income exposures to create a portfolio tailored to their investment needs.
Matt Tucker, CFA is the iShares Head of Fixed Income Strategy and a regular contributor to the iShares Blog. You can find more of his posts here.
Bonds and bond funds will decrease in value as interest rates rise. Bond funds are subject to credit risk, which refers to the possibility that the debt issuers may not be able to make principal and interest payments or may have their debt downgraded by ratings agencies.


