“Performance Anxiety?!”
by Jeffrey Saut, Chief Investment Strategist, Raymond James
September 10, 2012
“It was the rally that left many fund managers behind. Stocks jumped nearly 10% over the summer, defying the expectations of many hedge – and mutual – fund managers who had bet on a decline. They saw a multitude of headwinds from Europe's woes to the slowing U.S. economy and sluggish corporate earnings. Now, those defensive fund managers are facing what's known in Wall Street lingo as the "pain trade"; having to buy stocks just to avoid being left in the dust. The longer stocks hold the summer's gains, the more deeply the pain could be felt, forcing fund managers to start buying. That, in turn, could give stock prices another leg up and potentially generate a virtuous circle for the stock market and even more pain for those on the defensive. ‘A lot of people were waiting for the next big selloff and it never materialized,’ said Dan Greenhaus, chief global strategist at brokerage firm BTIG. ‘There's going to be that pressure to try and play catch-up and not just merely play along but to gain some outperformance’."
... Tom Lauricella, The Wall Street Journal (9/7/12)
In last week’s verbal strategy comments I suggested participants study the chart pattern of the S&P 500 (SPX/1437.92) and then think about what it would feel like if you were an underinvested portfolio manager (PM), or even worse a hedge fund that is massively short of stocks betting on a big decline. The concurrent performance anxiety would be legend because not only would you have performance risk, but also bonus risk and ultimately job risk. Accordingly, I have been opining that stocks were likely going break above the April highs (1420 – 1422) and then trade higher toward the 1450 – 1477 zone driven by what Dan Greenhaus said, “that pressure to try and play catch-up and not just merely play along but to gain some outperformance." Of course that performance pressure is magnified with end of the third quarter “report cards” due for PMs, followed by fiscal year-end, as many PMs close their books at the end of October.
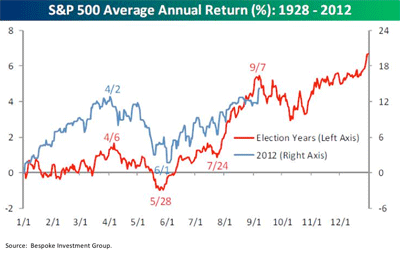
Last week the performance pressure increased noticeably when the SPX and the NASDAQ Composite Index both traded out to new reaction highs. In the NASDAQ’s case it “tagged” its highest level since 2000! While that is good news, it should be noted that the Financials are still 58.8% from their all-time highs, Telecom Services are 54.8% from their all-time highs, and Technology is 49.6% away. Still, the SPX has registered a topside breakout from one of the longest, and tightest, trading ranges in decades. Interestingly, in each of the four other instances this pattern has occurred the SPX has rallied an additional 2% - 5%. In the current case that would imply a rally to somewhere between 1445 and 1473, which is consistent with my longstanding target zone of 1450 – 1477. It would also be consistent with the historical chart pattern for the SPX in an election year that my friends at the invaluable Bespoke organization identified months ago (see chart on page 3). Accordingly, I would look for some kind of trading “top” this week and next followed by a decline into mid/late October that should sink the “footings” for the fabled year-end rally.
Speaking to Friday’s bleak employment report, as our economist Dr. Scott Brown writes:
“Not good. Payrolls rose less than expected in August and the two previous months were revised down. There were a few extenuating factors (such as seasonal adjustment in autos, which boosted July manufacturing at the expense of August), but not enough of these to offset the overall disappointment. The payroll figures aren’t terrible (we’re still adding jobs), but they are clearly disappointing. The unemployment rate dropped, but that was due largely to individuals leaving the labor force. I wouldn’t read much into that. The household figure components are notoriously volatile. The August FOMC meeting minutes showed that many policymakers felt that ‘additional monetary accommodation would likely be warranted fairly soon unless incoming information pointed to a substantial and sustainable strengthening in the pace of the economic recovery’ and Bernanke, in his Jackson Hole speech, noted that ‘the stagnation of the labor market in particular is a grave concern.’ Clearly, this report does not indicate ‘substantial and sustainable’ improvement, and the labor market outlook is weaker than it appeared just seven days ago. Hence, the odds of further Fed action are a lot higher. Extending the forward guidance (pushing out the date for which Fed officials expected short-term interest rates to remain ‘exceptionally low’) should be an easy decision for the Fed. Whether to undertake additional asset purchases (QE3) is still an open question. There are pluses and minuses. However, the August job market report should push the odds above 50%.”
Also in the “not good” camp was last week’s ISM Manufacturing report, which at 49.6 was the third month in a row below the magical 50.0 level and the lowest reading since August 2009. Somewhat offsetting that number was the ISM Non-Manufacturing report that came in stronger than expected at 53.7 versus the estimated 52.5. Combining the two reports leaves us with an overall reading of 53.2 that is still suggestive of no recession on the horizon. The softening economic numbers renewed hopes of another quantitative easing (QE) with an attendant lift in the equity markets. However, last week’s rally on QE3 hopes should have come as no surprise because gold, the ultimate indicator for QE3, has been telegraphing another QE for more than three weeks. Indeed, gold has risen from $1592 per ounce to last Friday’s close of $1740.
The other big news of last week was Thursday’s announcement by the ECB President Marion Draghi on how he is going to deal with Euroquake’s debt debacle. Simply stated, Mr. Draghi called for outright monetary transactions of government bonds in countries that needed help; he also declared that the ECB would NOT have seniority over other investors. That announcement left the yield on Spain’s two-year sovereign debt at 2.67% versus 6.57% last July. It also caused Spain’s equity index (IBEX) to rally roughly 5% and close above its 50-day moving average for the first time in more than a year. Obviously, the ECB news lifted all the world’s equity markets with the SPX gaining 2.23% for the week. In fact, all of the domestic indices I monitor were higher on the week with the strongest showing coming from the year-to-date lagging indexes like the Russell 2000 that gained 3.72%. In past missives I have postulated that when “they” start running the laggards a trading top would not be too far behind. I continue to feel that way.
The call for this week: I have been treating the June 4th “low” as THE “low” on a daily/intermediate-term basis. That said, the election year cycle suggests a “high” is due this month with a pullback into mid/late-October that sinks the footings for the year-end rally. The catalyst for a decline should surface this week out of either the Fed meeting or the German constitutional court meeting. In any event, a near-term trading top is due.

Click here to enlarge
Copyright © Raymond James


